Introduction
Viral Encephalopathy and Retinopathy (VER), also known as viral nervous necrosis (VNN), is a serious pathological condition that affects several fish species worldwide with severe consequences for the marine farming industry. Reliable and efficient diagnostic laboratories play a crucial role in the health management strategy and should provide a timely detection of pathogens.
Interlaboratory proficiency tests (IPTs) are an essential tool to maintain quality standards and performances of diagnostic laboratories at a high level. The participation to IPTs is one of the most effective ways to achieve comparability of measurements among laboratories. For these reasons, taking part in an IPT trial - when available - is highly recommended or even mandatory, in some cases.
Since its first edition in 2016, the VER IPT has been addressed to the laboratories performing molecular methods, adopting both real time RT-PCR (rRT-PCR) and conventional RT-PCR for diagnostic or research purposes in the field of aquatic animal diseases.
The aim of this paper is to report the results obtained by the laboratories that participated in the fourth edition of the VER IPT that was held in 2022.
Material and Methods
Contents of ampoules
The panel included 10 ampoules. Six out of 10 vials were spiked with different Betanodavirus species, namely: RGNNV (redspotted grouper nervous necrosis virus), SJNNV (striped jack nervous necrosis virus), BFNNV (barfin flounder nervous necrosis virus) and the reassortant strain RGNNV/SJNNV. Viral species were selected according to their relevance and prevalence in the European seas.
The viruses were propagated on E-11 cell line (Iwamoto, Nakai, and et al. 2000) at 25°C or 20°C depending on the viral strain; cell supernatants were harvested at completion of the cytopathic effect (CPE) and clarified by centrifugation.
Viruses were titrated in E-11 cell culture before heat inactivation (1 hour at 70°C). The pre–inactivation titre was calculated according to the Reed and Muench Formula (Reed and Muench 1938). Where required, viral strains characterized by a high pre-inactivation titre were diluted with sterile MEM before inactivation and lyophilization.
Four out of 10 ampoules contained negative samples, namely sterile MEM (Sigma M2414) alone or additioned of 10% yeast extract (CONDA-Pronadisa) and negative serum collected from healthy European Sea Bass (Dicentrarchus labrax) reared at the Istituto Zooprofilattico Sperimentale delle Venezie (IZSVe) experimental facilities.
All the Betanodavirus contaminated samples were mixed with equal volumes of 20% w/v lactalbumin hydrolysate solution (Sigma Lactalbumin enzymatic hydrolysate) and lyophilized in glass ampoules. Negative samples, with the exception of sea bass serum, were also added with lactalbumin hydrolysate solution.
Contents, viral load and references of positive samples, as well as details about the negative specimens, are reported in Table 1.
Homogeneity and stability test
Prior and after distribution, 3 sets of panels were tested in order to ascertain the homogeneity and stability of the contents.
Three sets of panels also underwent conventional RT-PCR and sequencing for the confirmation of viral genotype/species (Bovo, Gustinelli, et al. 2011; in house protocol for BFNNV available upon request). One additional panel was tested after a 15-day storage at 37°C to further ascertain the heat stability of the ampoule contents.
Shipment of the IPT
All the parcels were shipped in October 2022 and, whenever possible, participants were provided with the AWB tracking number, which allowed them to monitor the movement of the package online. The participation to the IPT was free, whereas shipping costs were charged to the participants.
As the samples were lyophilized and tested for stability against thermal stress, the panel was shipped at room temperature.
Participants were asked to fill in a spreadsheet with the obtained results and any other relevant information on the diagnostic approaches applied.
In order to guarantee the anonymity of the participants, at each IPT edition the laboratories are assigned a different alphanumeric code sent together with the panel of samples.
Interpretation of results
Correct results (Positive/Negative for the presence of Betanodavirus) scored 1, while incorrect, missing or doubtful results were scored 0. The cycle threshold value (Ct) detected by rRT-PCR, if reported by the participant, was not sufficient to be assessed as result, but the interpretation of the obtained Ct was required.
Viral species identification was not subjected to evaluation.
Results
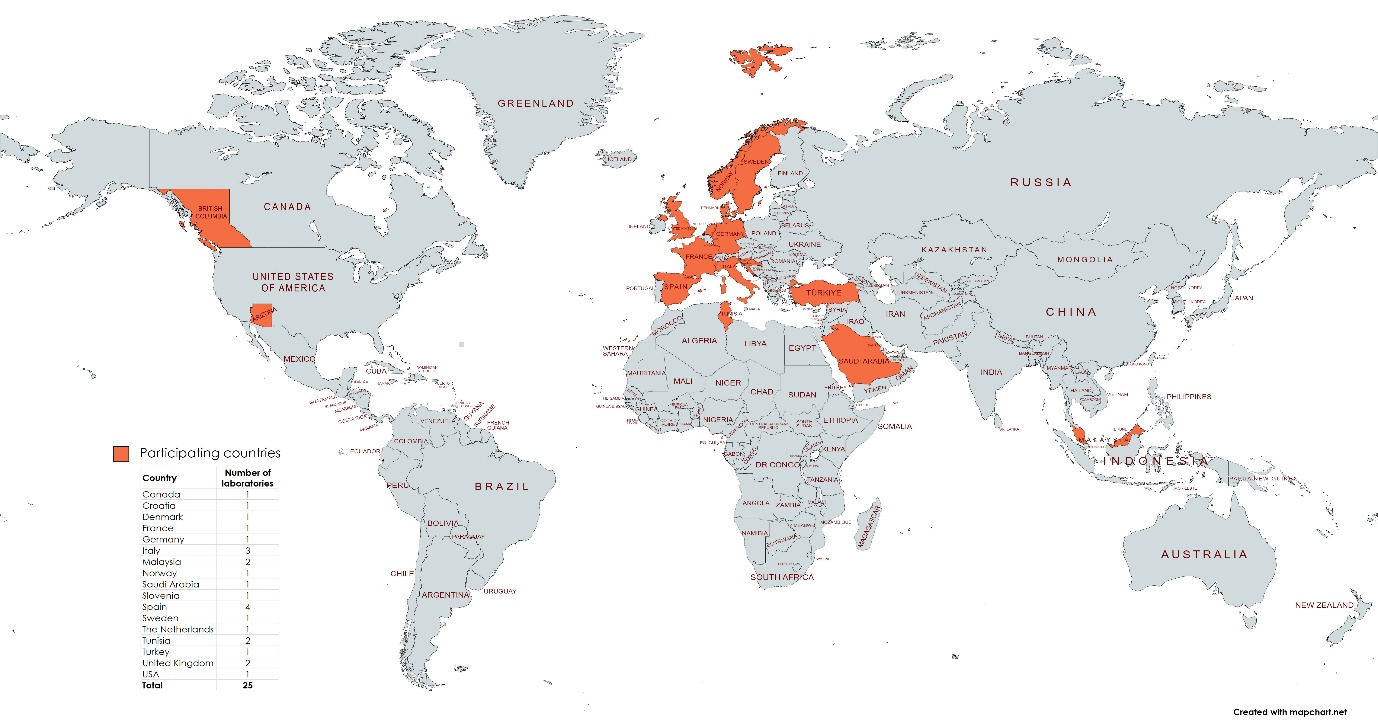
Twenty-five (25) laboratories applied to take part in the 4th edition of the VER IPT, and the panel was successfully shipped to 17 different countries.
Seventeen laboratories were from European countries, while the remaining 8 were from extra-EU countries. Thirteen participants were from the Mediterranean basin area (Figure 1). Both public/research and private laboratories were present. All participants adopted rRT-PCR methods to complete the exercise, even if 13 laboratories declared to have used more than one single technique.

With reference to the rRT-PCR protocols, 19 laboratories selected published methods to test the IPT samples: 14 laboratories used Betanodavirus generic assay targeting RNA1 or RNA2 of all the known Betanodaviruses species (Baud, Cabon, et al. 2015; Panzarin, Patarnello, and et al. 2010) while 5 laboratories used other published methods (Hodneland, García, et al. 2011; Olveira, Souto, and et al. 2013, 2021). Of the remaining 5 laboratories, 3 selected commercially available kits whereas 2 used in-house developed methods.
Homogeneity and stability tests gave good results, showing minimum variation in terms of Ct values of the ampoules contents even after the thermal stress test. Hence, the panel was considered suitable for the use.
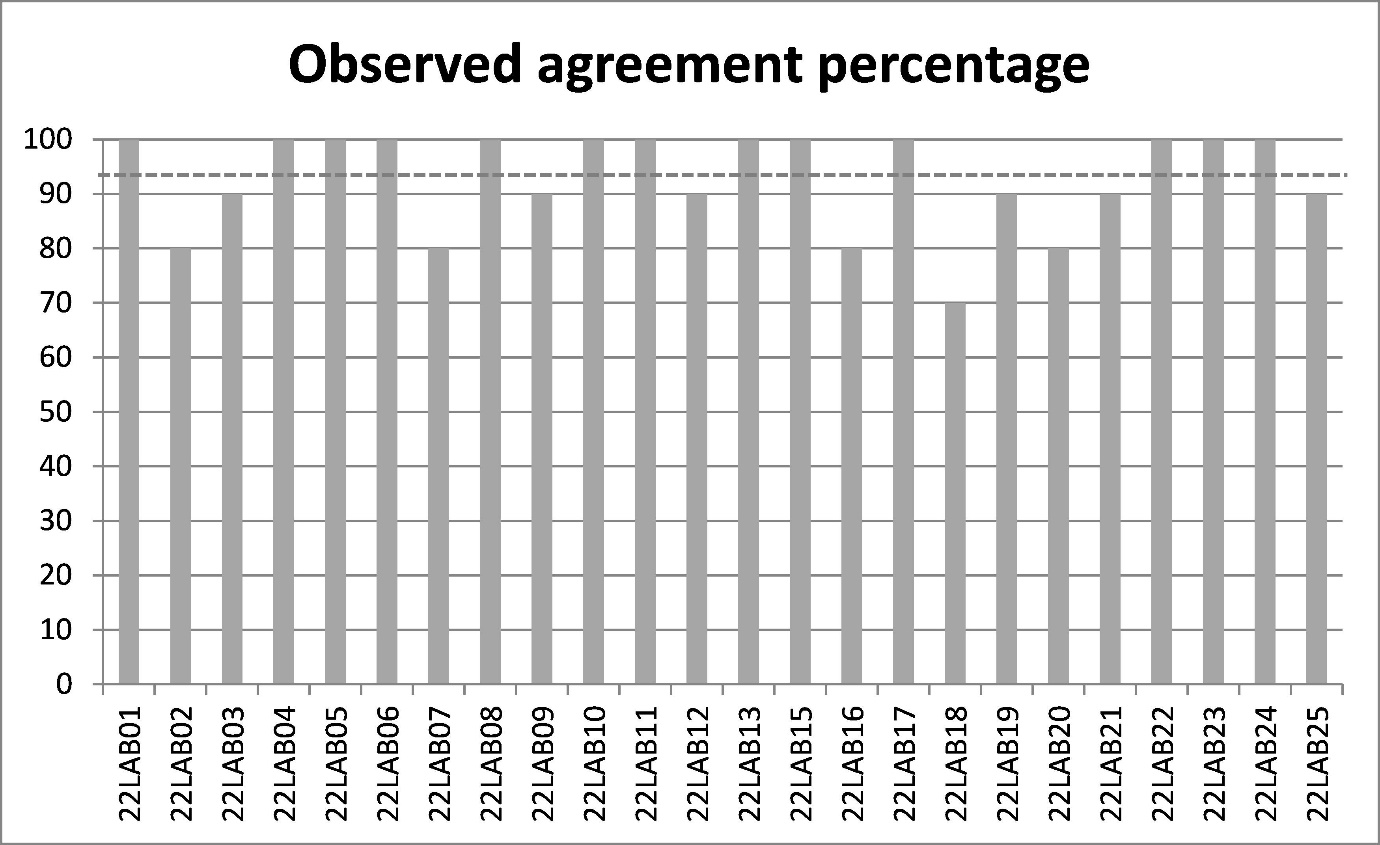
Thirteen out of the twenty-four participating laboratories obtained the maximum score, totaling 54.16% of the participants. The remaining 11 produced an observed agreement percentage ranging from 70% to 90%. The mean of correct results was 92.9%, while median and mode were equal to 100%. The overall agreement Kappa was k= 0.7888 (p=0.0000). Detailed results are reported in Tables 2 and 3.
Thirteen laboratories showed a perfect agreement, 9 showed a substantial agreement and the remaining 2 a moderate agreement. The level of agreement of results based on K values was measured using the Landis and Koch 1977 scale.
With reference to the ampoules contents, samples n° 3, 4, 7, 8 and 10 were correctly identified by all the laboratories, followed by vial n°1 and 6, which were correctly identified by 23/24 laboratory.
Vial n° 5, a low titer positive sample (RGNNV genotype strain 283.2009) was the most frequently incorrectly assigned, with only 14 out of 24 laboratory correctly identifying it as positive. Vials n° 3 and 4 contained the same virus, namely the RGNNV/SJNNV strain 367.2.2005 Betanodavirus, as well as vials n° 8 and 9 which contained the cold water BFNNV strain JFIWa98. Figure 2 and Table 4 provide detailed results.
_is_showe.jpeg)
Genotyping of the samples was obtained by all the participants through the use of end point RT-PCR and sequencing, according to different published protocols (Bovo, Gustinelli, et al. 2011; Dalla Valle, Toffolo, et al. 2005; De La Peña, Suarnaba, et al. 2011; Grotmol, Nerland, and et al. 2000; Nishizawa, Toshihiro, et al. 1994; Thiery, Arnauld, et al. 1999; Toffolo, Negrisolo, and et al. 2007). Twelve out of 24 participants (50%) reported the partial genetic characterization (meaning at least one out of two genetic segments) of the detected viruses, while eight (8) laboratories provided the complete genetic characterization.
Twelve laboratories identified Betanodavirus genotype according to RNA2 genes, while eight (8) laboratories used only the RNA1 gene. Six out of 8 laboratories (75%) sequencing RNA 1, and 4 out of 12 laboratories (33%) sequencing RNA 2, correctly identified the viral strains included in the exercise. Overall, only two (2) laboratories provided the complete and correct characterization of the viruses included in the panel, meaning that only 8.3% of the participants were able to complete the full exercise correctly.
Discussion
Aquaculture represents the fastest growing food production sector able to satisfy the increasing demand for animal protein among consumers. However, several obstacles hinder its continuous growth, with diseases posing one of the primary challenge (Naylor, Hardy, et al. 2021). VER disease is indeed considered one of the most important threat to Mediterranean aquaculture (Bandín and Souto 2020; Doan, Vandeputte, and et al. 2017). Hence, the future of aquaculture heavily relies on international cooperation and agreements aimed at disease control and containment.
In this context, a robust, recognized and reliable diagnostic capacity is of paramount importance to limit the spread of diseases and facilitate trade. Participation in IPTs, typically organized by reference laboratories recognized by international authorities such as the WOAH (World Organization of Animal health) or the European Commission, serves as the ultimate tool to achieve this goal (Ariel, Nicolajsen, et al. 2009; Earley, Astles, and Breckenridge 2017). Since 2016 the WOAH Reference laboratory for VER has been organizing every other year an IPT (Toffan, Buratin, et al. 2021; Toffan, Buratin, and et al. 2017). The panel of the 4th IPT-VER, held in 2022, included 10 vials, six of which contained freeze-dried inactivated Betanodavirus strains belonging to 4 different viral genotypes; for the first time, the cold water strain BFNNV was also included.
The panel of samples was shipped to 25 participants located in 17 different countries. The wide participation from countries all over the world confirmed once again the usefulness of this exercise. More than half of the participants (54.16%) obtained the maximum score, an overall good results. .If we consider 90% as an acceptable score, it turned out that only 5 participants (20.83 % of the total) did not manage to reach a sufficient output due to their incorrect identification of the contents of 2 or more samples. For the first time, the 2022 edition of the IPT included the BFNNV genotype in the panel of viruses to be identified. This virus, at a very high titer, was contained in two identical vials, namely sample n° 8 and n° 9. All the participants correctly identified sample n° 8, while sample n° 9 was missed by one participant only. It appears that the detection of BFNNV does not pose particular difficulties from a diagnostic point of view. Sample n° 5 contained the RGNNV genotype at a very low tire to challenge the laboratory sensitivity: as expected, it was the most frequently misdiagnosed with almost 50% of the laboratories assigning it as negative. Given such feedback, we strongly recommend these laboratories to refine their diagnostic sensitivity, for example by using the leftover samples to try to improve the limit of detection of their respective protocols.
On the other hand, none of the negative samples was scored as positive, meaning that the participants did make an effort to avoid cross contamination. During the previous edition of the VER-IPT, this had been a major issue (Toffan, Buratin, et al. 2021).
The rate of success during the last edition of the VER-IPT is in line with the previously achieved ones; however, it must be kept in mind that the number of participants was the lowest (we counted 32 participant in 2018 and 27 in 2020). In addition, the participating laboratories are not necessarily always the same for each edition of the IPT and this makes it very difficult to assess whether there has been a real improvement of performances.
Among the most frequently used rRT-PCR protocols, the one designed on RNA1 by Baud, Cabon, et al., 2015, and that designed on RNA2 by Panzarin, Patarnello, and et al. 2010. According to the results obtained by the participants that used these protocols (data not shown), they are both robust and reliable.
With reference to viral species identification, only 50% of the participants completed this part of the exercise.
There has been a moderate improvement in the performance of the laboratories conducting sequencing, with the exception of sample n. °5, which presented challenges in sequencing due to its low viral load during preparation. Overall, the laboratories that completed the genotyping exercise scored quite well. As previously reported, laboratories should work towards improving their capacity to correctly identify the genotype. The VER-IPT circuit will continue to be organised every two years, and a regular participation will provide the laboratories with an important tool for monitoring their performance.
Acknowledgement
Credits go to all the technical staff members of the IZSVe. Acknowledgments go to all the participants as well.