

1. Introduction
Stress and diseases commonly impair the welfare of farmed fish. Often reduced welfare of fish has been related to a change in fin conditions which was the main reason for basing many welfare assessments on evaluation of the fin condition - especially the condition of the dorsal and the caudal fins (Noble et al. 2018; Stien et al. 2018; Flores-García et al. 2022). However, due to species-specific differences in social behaviour and aggression levels it can be assumed that fin condition assessments are more or less useful for different species of farmed fish. Moreover, there has been some inconsistency in the recommendations of optimal fin condition assessment methods.
One method that was one of the first broadly used methods for fin condition assessment is the Kindschi index according to Kindschi (1987). This method relies on the measurement of the longest fin ray relative to the total body length of the fish. Since also the caudal fin length can be affected by fin erosion, the method of Kindschi using the total body length as a basis contains some bias. Therefore, an improved Kindschi method was proposed by Ellis et al. (2009) which uses the standard body length as a basis. Shortly after that, the fin index according to Good et al. (2011) was published which relates the longest fin ray to the length of the caudal fin. A not commonly used method is the assessment of splits for each fin and the preparation of contingency tables for comparison of the frequencies of fin splits. Finally, a new method that is presented here is the computer-assisted measurement of the fin area and the calculation of the area index (AI) by relating the fin area to the total body length or the standard body length (improved AI).
In order to compare the suitability of the methods mentioned above for the comparison of fish from different facilities, the present study investigated the fin indices based on different methods for three different fish species in three different size classes for most of the fish species over time, and aimed at recommending the most useful fin condition assessment method for fish farming. This adds relevant information to the calculation of indices and the integration of fin condition data into welfare assessments in the future.
2. Materials and Methods
2.1. Selection of the farms
In total 6 commercial fish farms producing fish for human consumption have been selected. These included two rainbow trout (Oncorhynchus mykiss) farms, two farms raising European perch (Perca fluviatilis), and two farms raising common carp (Cyprinus carpio L.). The rainbow trout farms were race-way farms producing 80 to 100 t fish per year, whereas the facilities raising perch or carp were in-door, recirculating farms. The carp farms were only small in-door farms selling up to 5 t per year. At each sampling up to 15 fish have been sampled belonging to maximum three size classes as defined in Table 1. The desired number of fish per size class was 5 each, and the mean size class was 4.67 over all fish farms. For the two trout farms, the size of the fish in each class could not be the same since the second trout farm provided smaller fish of less than 300 g body weight only which were categorized as small fish for trout farm one (Table 1).
2.2. Preparation of the pictures on-farm
The fish have been taken from the rearing tanks and were immediately anaesthetized with tricaine methanesulfonate (< 150 mg/L, Pharmaq, Overhalla, Norway) buffered with sodium bicarbonate in a 10 L bucket. The camera used was an iPhone 11 Pro camera with 12 Megapixels. The fins were spread with a medical clamp or forceps to maximize the visibility of the fin area. Comparable illumination of the fish was achieved by using a Rollei LED RGB lamp set to 7`500 K (Rollei, Switzerland). Each fish was placed on a mm scaling paper for later size calibration. Each picture included a colour palette placed close to the fish (PC-Ostschweiz, Switzerland).
2.3. Processing of the individual pictures
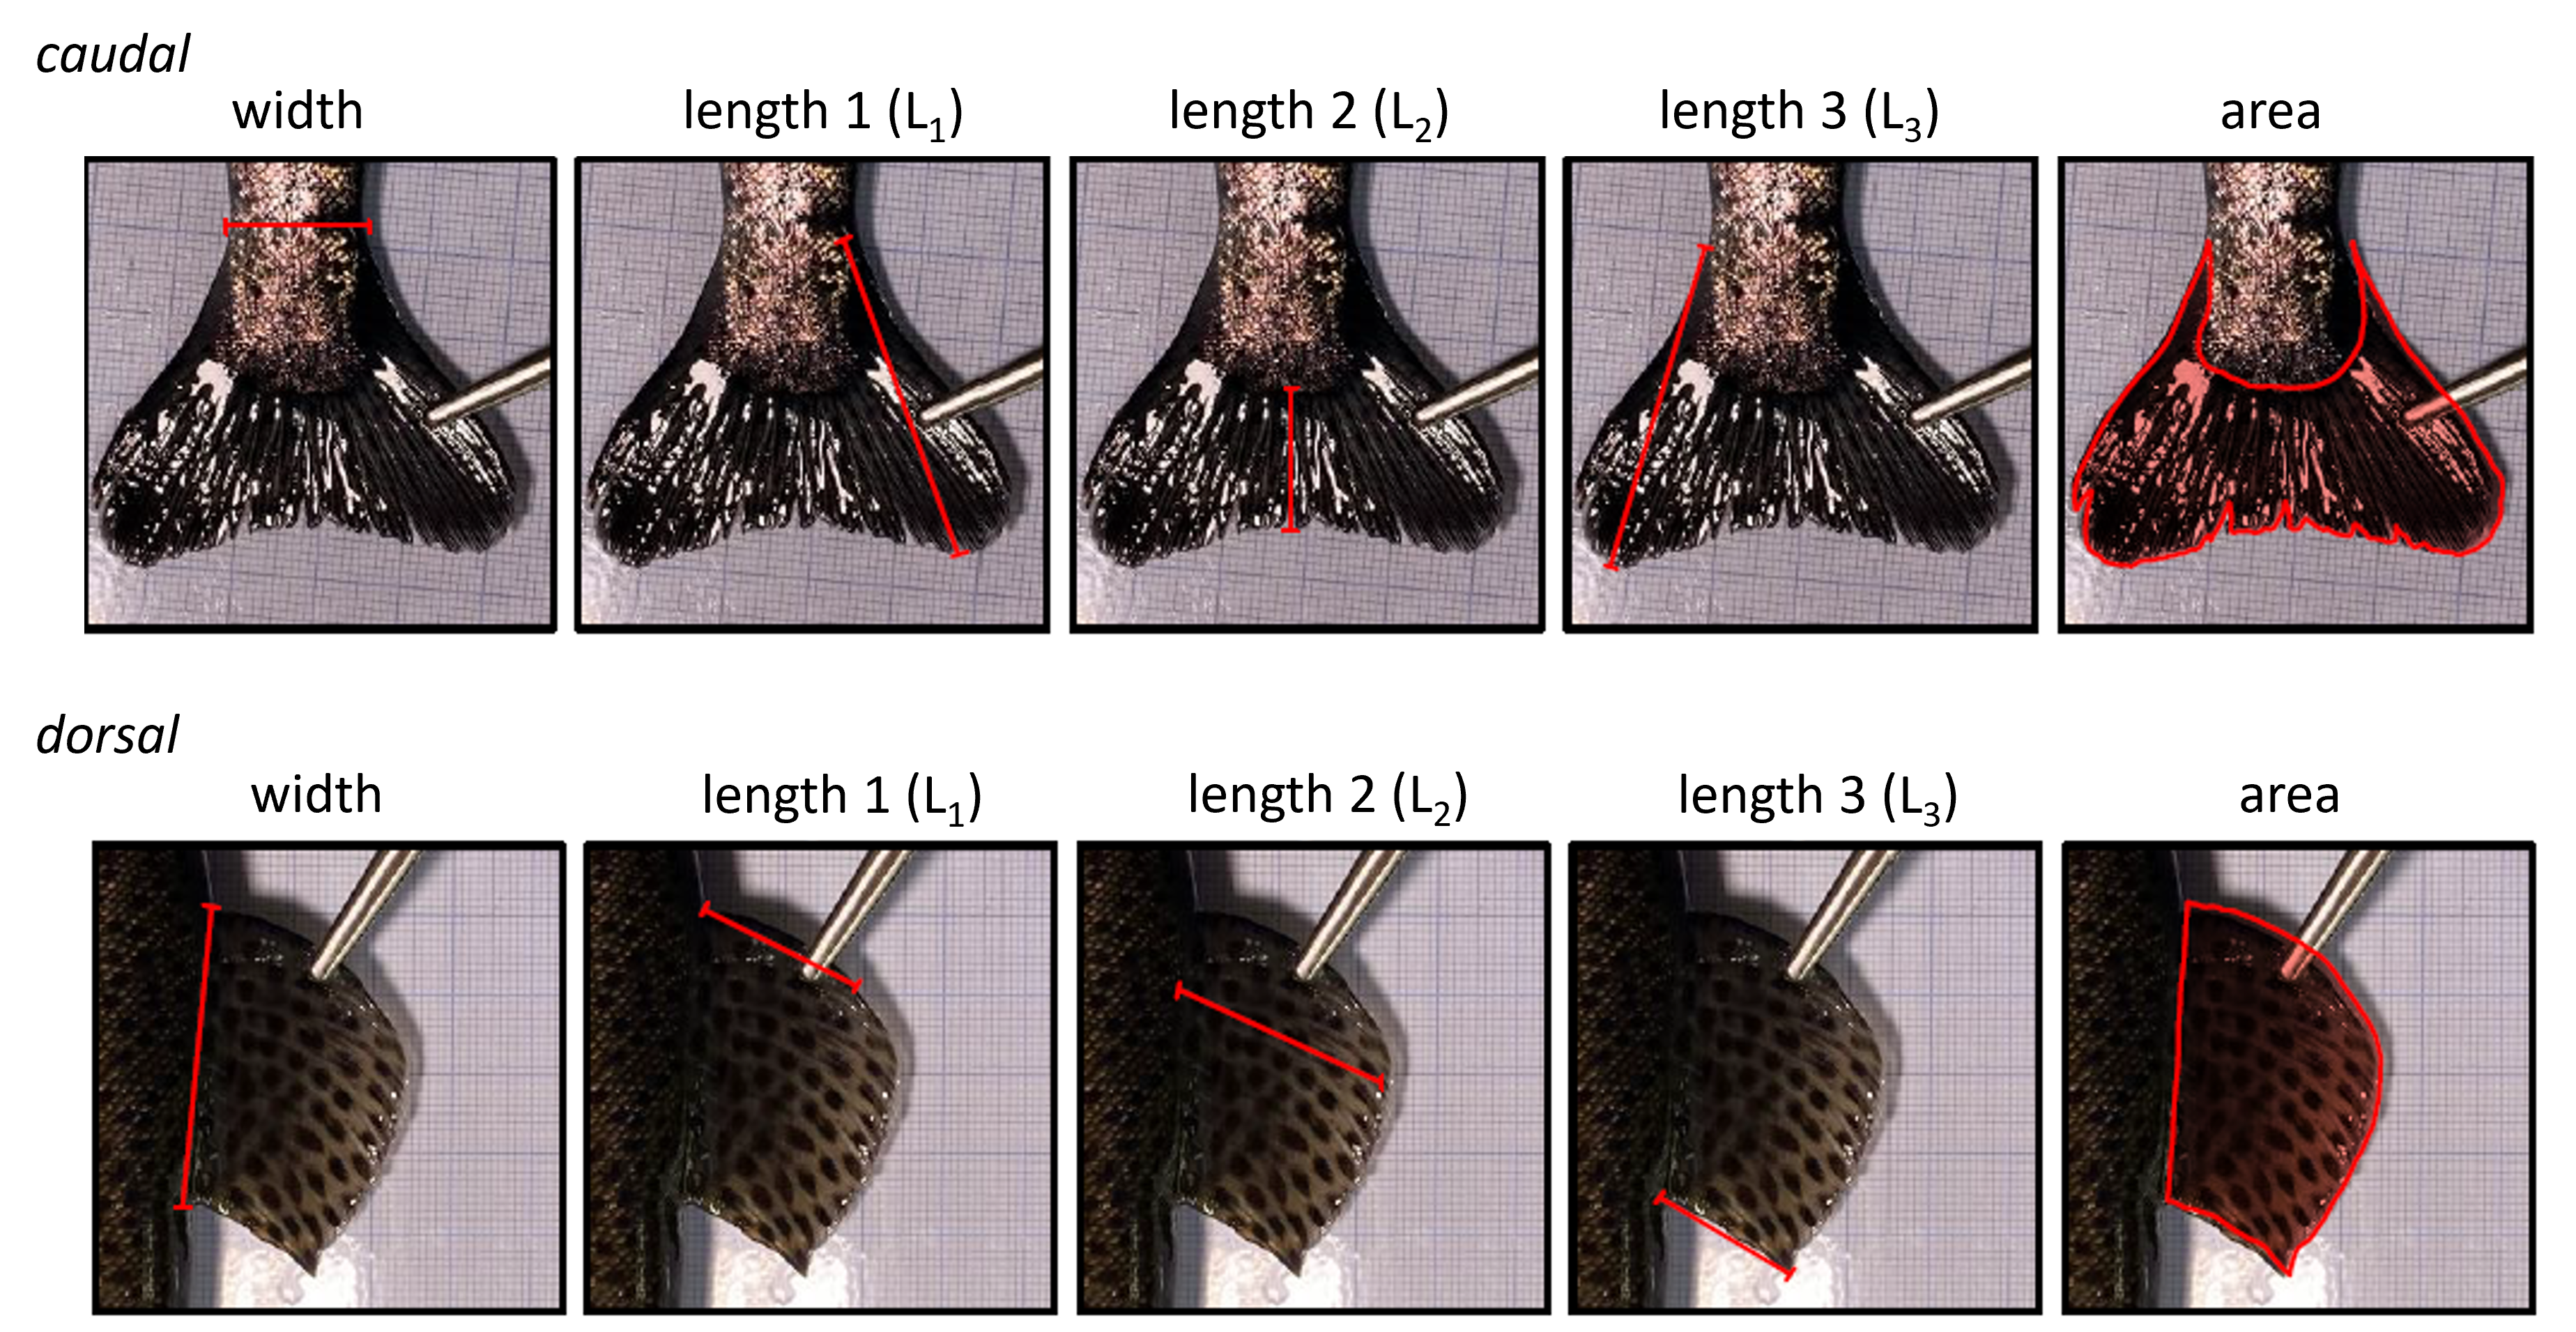
From each fin a single picture has been taken which was subsequently analysed on a computer. For this, the pictures were loaded into Adobe Photoshop CS5 with automatic correction of the colours based on the information derived from the colour plate inclusion. Fin length L1, L2 and L3 (Figure 1) and area was determined in Adobe Photoshop CS5 with the ruler tool after calibrating the tool with the set scale option. All data were exported to Microsoft Excel tables for subsequent calculation of the different indices.
_and_the_area_measurements_f.png)
2.4. Calculations and statistics
The following parameters have been calculated from the fin measurements:
-
The relation of the longest fin ray and the length of the caudal fin which was described as a fin index by Good et al. (2011). For this the longest way from the caudal fin base to one of the tips of the fork have been used.
-
The Kindschi index by calculating the longest ray length of each fin relative to the total body length of the fish (Kindschi 1987) and the improved Kindschi method using the standard body length as suggested by Ellis et al. (2009).
-
The number of fin splits deeper than 5 mm was counted.
-
The relation of the fin width at the basis of the fin to the fin length L1, L2 and L3, since the fin basis is assumed to be correlated with the body length of the fish.
-
The area of each fin in relation to the total body length and the standard body length.
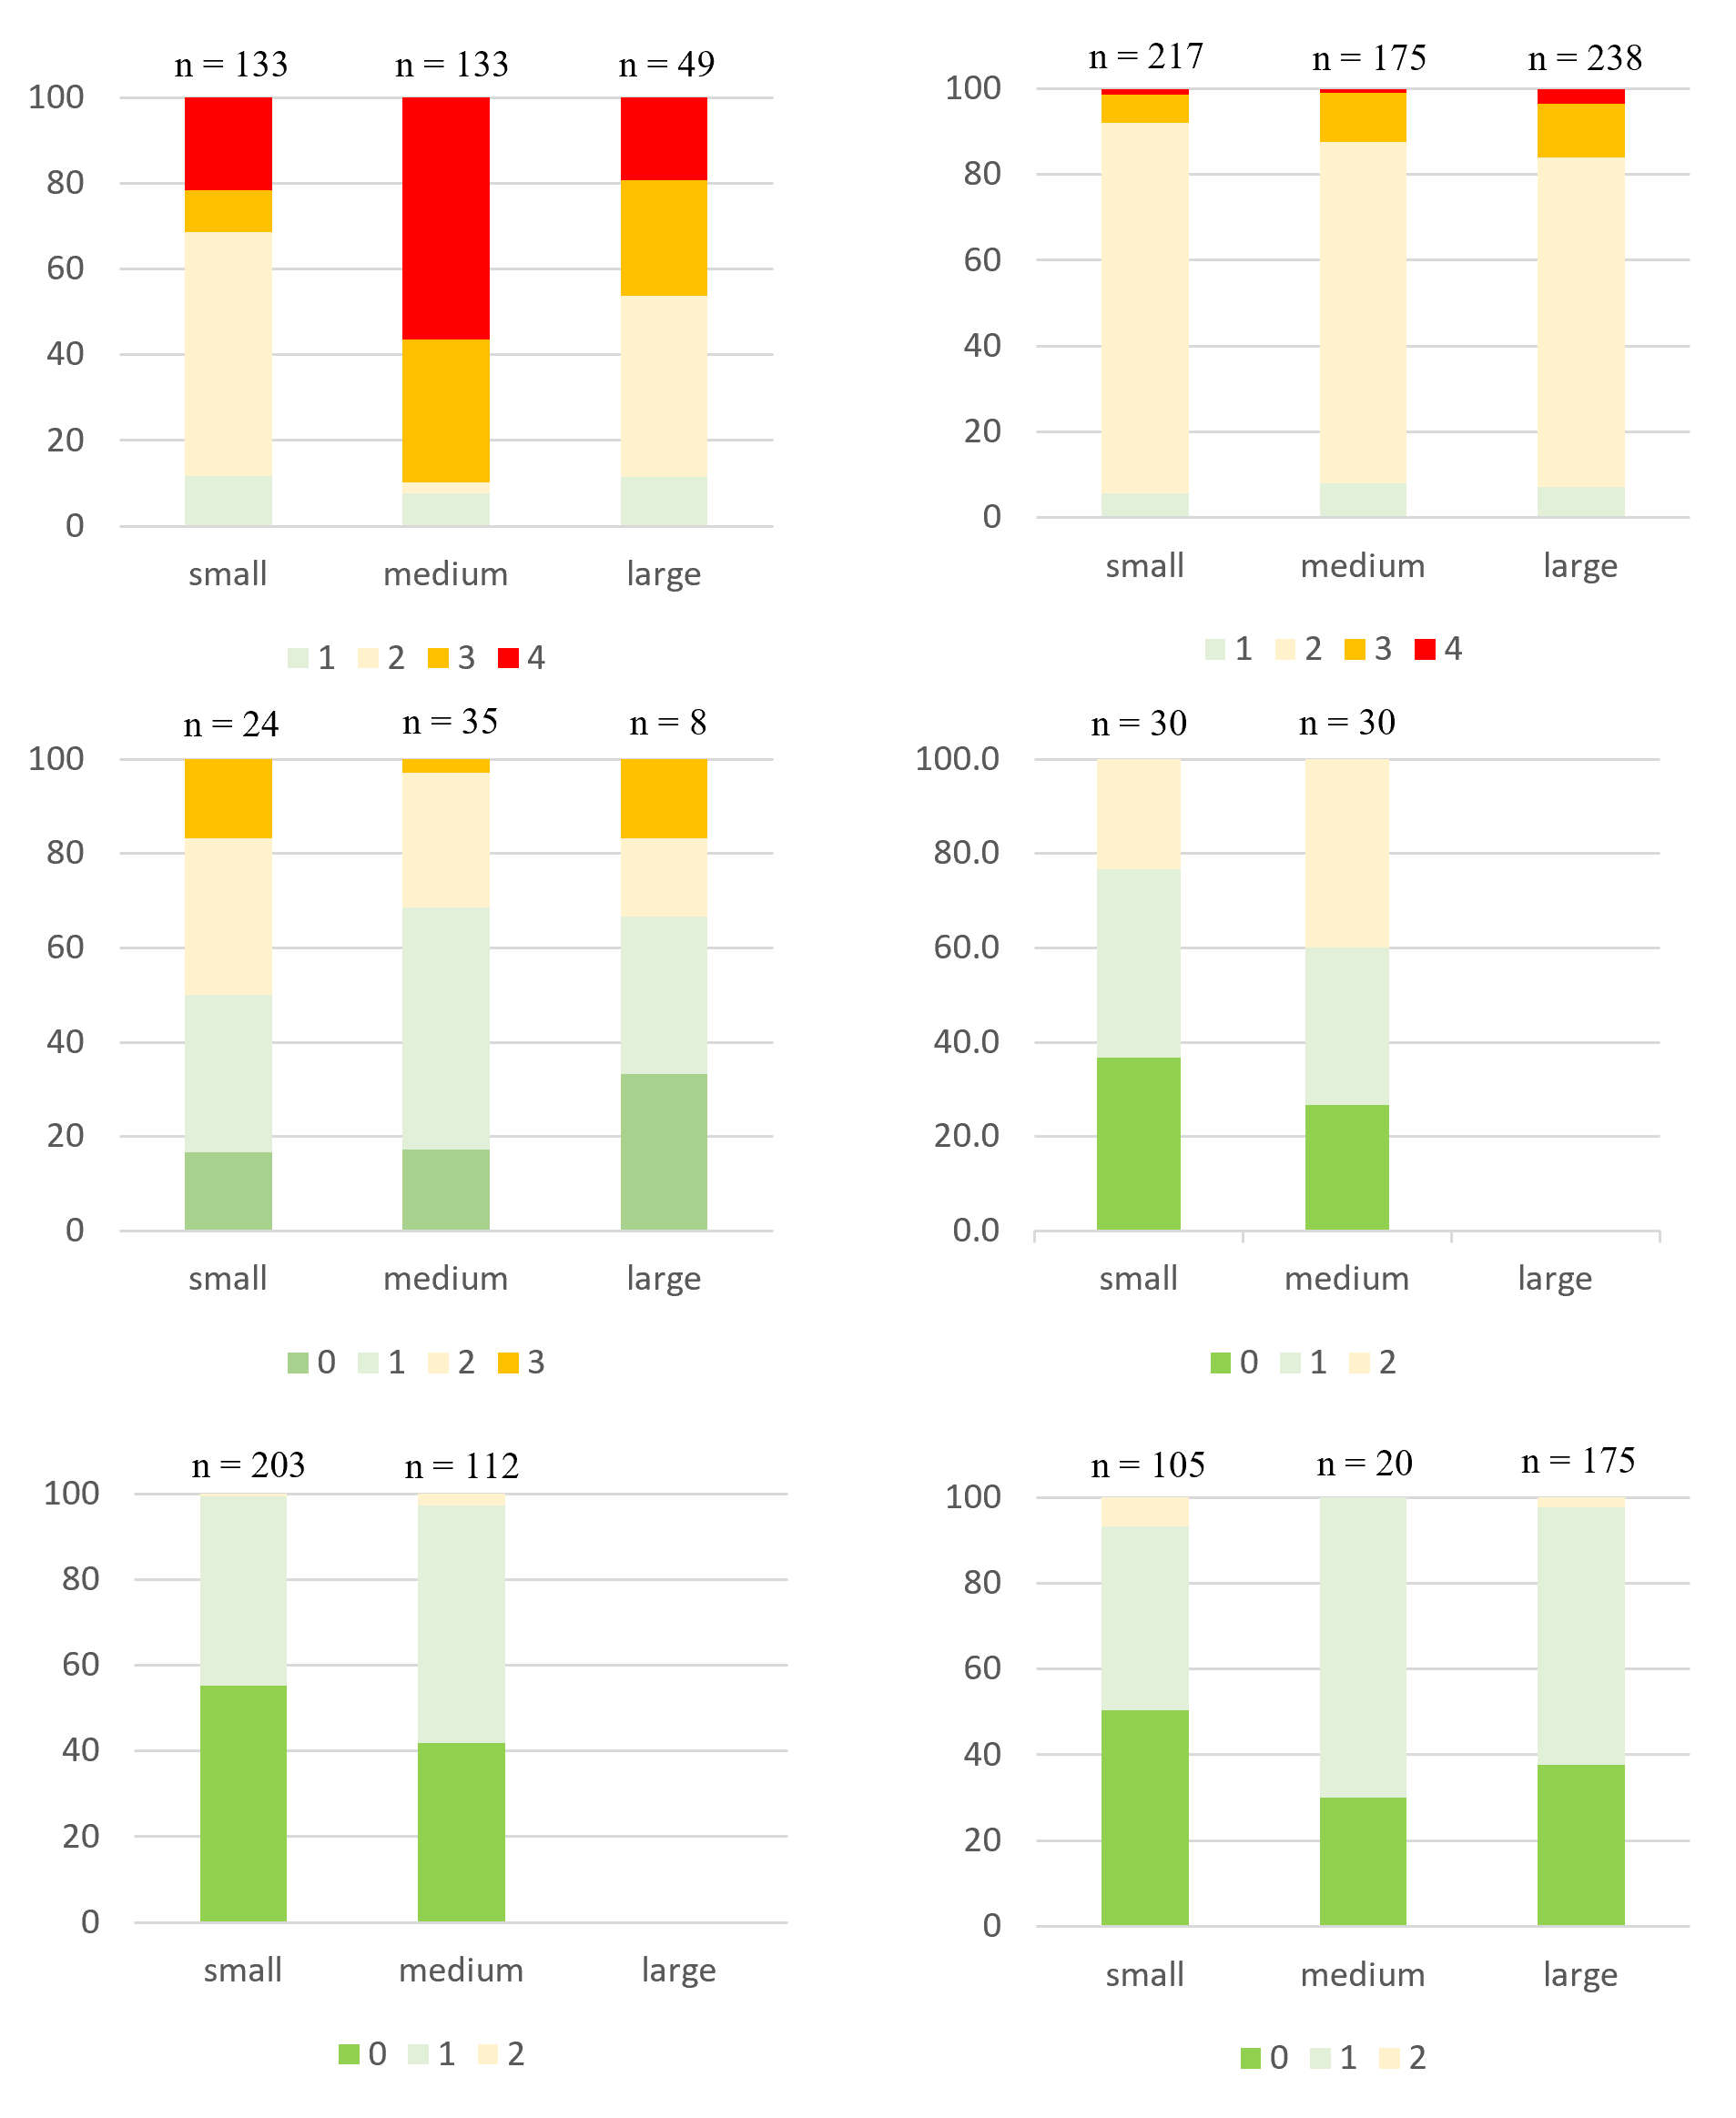
The fin measurements were compared to the visual estimation of the fin condition by classification of the fin appearance by using 5 different categories (Figure 1 and 2). There have been no trout for category 0 (Figure 2) since this category applies to wild fish which commonly show better fin conditions than farmed fish (Bosakowski and Wagner 1994; Rasmussen, Larsen, and Jensen 2007).

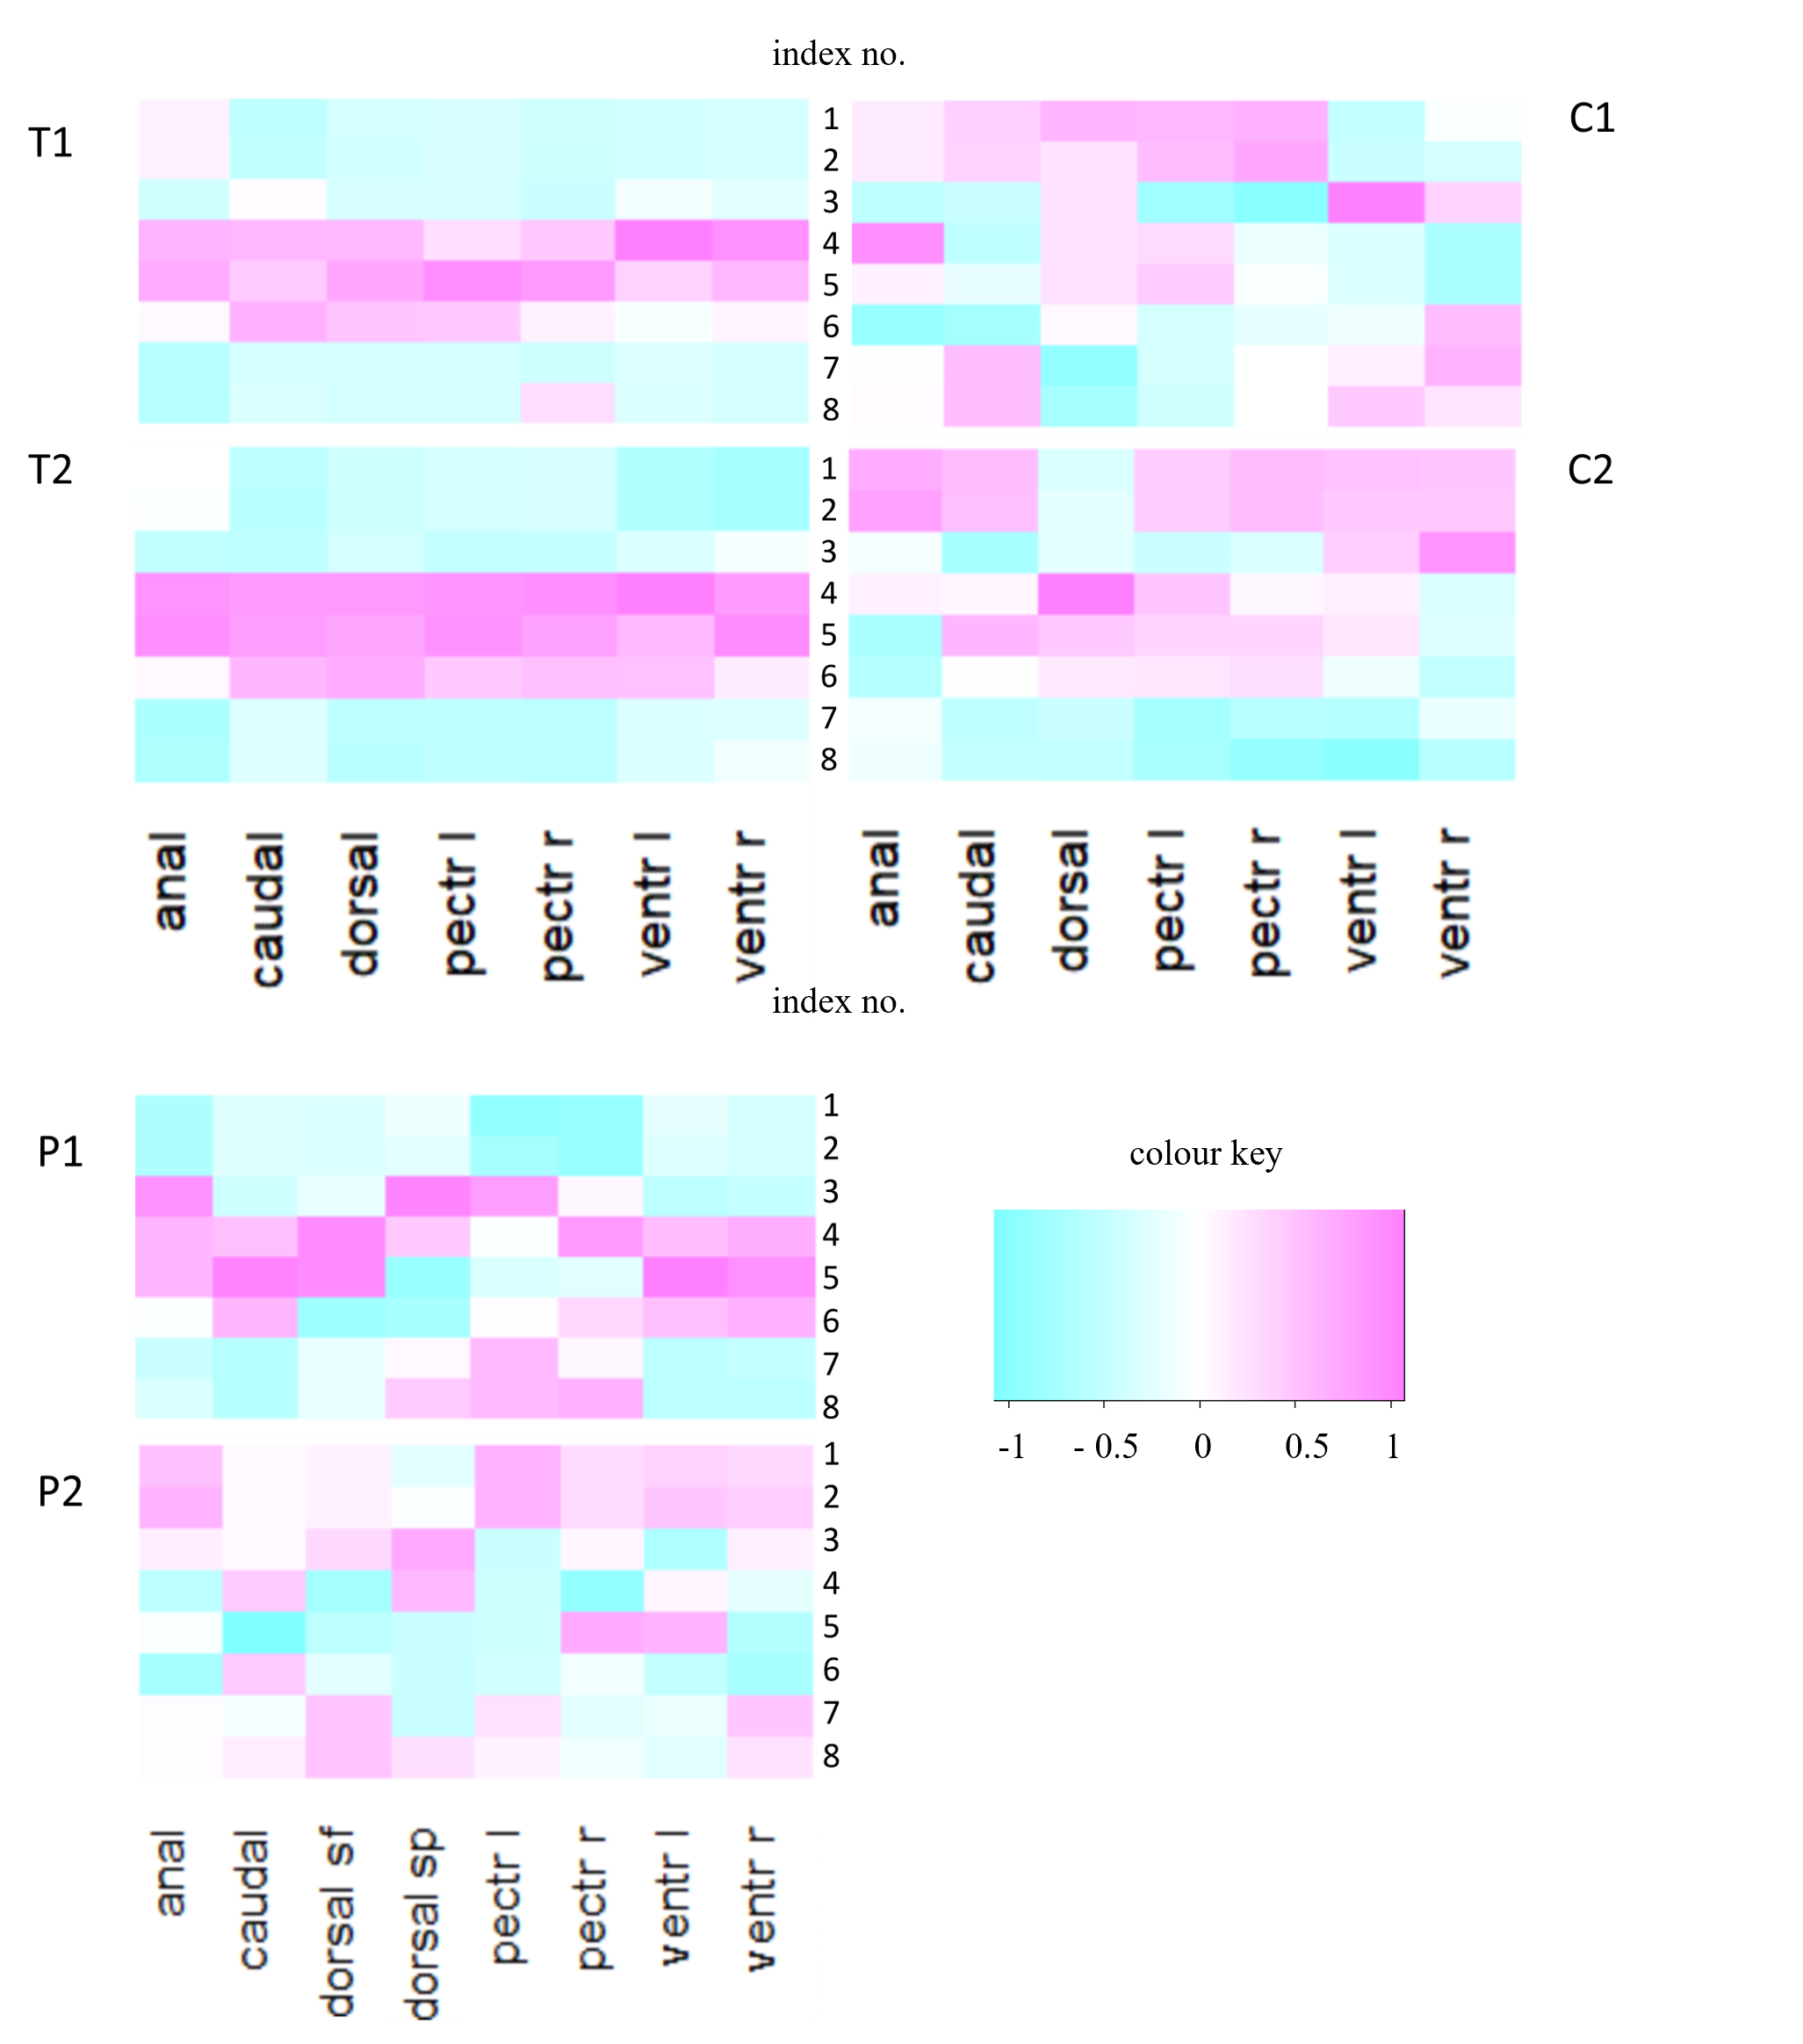
For the statistical calculations, Spearman correlation analyses have been performed with the hmisc package (Harrell and Dupont 2024) in R studio (version 2022.02.1 Build 461) for each index and each fish farm separately to analyse potential congruency of each index with the visual fin score. The heatmap function in R studio was subsequently used for visualization. For the number of fin splits contingency tables have been prepared and Fisher exact tests using the function fisher.test have been used for comparison of the frequencies of fin splits in each fin condition category. The relationship of the standard body length and the width of the fin bases was analyzed with linear models supported by the tidyverse (Wickham et al. 2019) and ggpubr (Kassambara 2023) packages in R.
3. Results
3.1. Mean size of the fish and fin condition classification
The analyses showed that the mean weight for small trout from Farm T1 was 260.6 g and the mean weight for medium trout was 338.7 g, whereas large trout had a mean weight of 491 g. On farm T2 the small trout that were sampled had a mean weight of 74.4 g, whereas medium and large trout had a mean weight of 199.6 g and 333.7 g, respectively. On the first perch farm all three size classes were available with mean weights of 79.8 g, 156.2 g, and 373.5 g, respectively. Perch farm 2 was only able to provide small and medium-sized fish with mean weights of 66.6 g and 111.5 g. For the first carp farm, also only small and medium-sized fish were available with mean weights of 77.6 g and 114.5 g, respectively. For the second carp farm mean fish weights of 72.9 g, 160.5 g, and 323.7 g were noted for the small, medium and large size classes.
With respect to the visual classification of the fin condition, trout appeared to have a worse fin condition in total compared with the other two fish species (Figure 3). For trout, the lowest fin conditions category was noticed for the pectoral fins from farm T1 with 3.5 and 3.58 for the left and right body side of medium-sized fish and 3.25 and 3.0 for the left and right body side of the large fish (details available here: https://figshare.com/articles/dataset/Fin_condition_data_over_time_and_also_shown_for_the_different_fish_size_classes/25692924). For the second trout farm, these values were lower with scores of 2.0 and 2.18 for the left and right body side of medium-sized fish, and scores of 2.53 and 2.05 for the left and right body side of medium-sized fish. For both trout farms, the mean score for the pectoral fins ranged between 2.0 and 2.67 for the smallest fish. For trout, the fin with the best score was the ventral fin on the left body side of small-sized trout from farm 1 with a mean score of 1.79, followed by the ventral fins of the smallest size class from the first trout farm and the ventral fins on the left body side of medium-sized trout from the second farm with scores of 1.79 and 1.84, respectively. In parallel to the other fin indices, the visual scores for trout also showed changes over-time (https://figshare.com/articles/dataset/Fin_condition_data_over_time_and_also_shown_for_the_different_fish_size_classes/25692924).

For the perch farms, only data from one sampling date per farm were available and the data sets are consequently less reliable than for the other two fish species. The lowest score for farm P1 was observed for the pectoral fins of medium-sized fish with mean values of 0.67 and 0.83 for the left and the right body side. In comparison, the best score for farm P2 was observed for the pectoral fins of small-sized fish with mean values of 0.40 and 0.60 for the left and the right body side. For both perch farms, the highest score was 2.0 which was observed for the dorsal and caudal fin of small fish in farm P1, and for the caudal fin and the ventral fin on the left body side of medium-sized fish of farm P2. The fin condition over time has not been evaluated for the perch farms due to the low number of farm visits for this species.
For the first carp farm, a slightly better mean fin condition was noted compared with the second carp farm. For the first carp farm, the mean anal fin score was slightly above 1 (i.e., 1.00 for small fish and 1.13 for medium-sized fish) and the mean score of the caudal fin for the medium-sized fish was also 1.0, whereas the scores for all other fins were below 1 indicating a good condition of the fins. For the second carp farm, again the anal fin of all fish size classes had mean scores of 1.0 or higher, whereas all other fins had a score of less than 1.0. However, the lowest score for the second carp farm was noted for the pectoral fins of the small fish with mean values of 0.42, whereas the best mean score for carp of the first farm was observed for the ventral fins of small fish with mean values of 0.17. In parallel to the other fin indices, the visual scores for carp showed considerable changes over-time (https://figshare.com/articles/dataset/Fin_condition_data_over_time_and_also_shown_for_the_different_fish_size_classes/25692924).
3.2. Fin index according to Good et al. (2011)
The analyses showed that for the trout farms, the values for the Good`s index were slightly higher for most of the fins of fish from the farm T1. Lower coefficients of variation (CV) for all fish sizes together were observed for the anal, the caudal and the dorsal fin of fish from the first trout farm indicating that the values were more homogenous for this farm (Table 2). In contrast, the CV values for the pectoral and the ventral fins were lower for the second trout farm.
_for_each_index_(1___area_index__2___area_index.png)
The values for the indices according to Good et al. (2011) were similar for all fish from both perch farms (Table 2).
For the carp farms, the CV values of most of the fins were similar, except for the caudal and dorsal fin, for which the fish from farm one had considerably more variation for the values. Thus, looking at the variation of the values across the size classes of carp, the first farm had lower values except for the caudal and dorsal fins.
3.3. Kindschi indices and the improved method according to Ellis et al. (2009)
For all fish farms investigated, the Kindschi indices showed the lowest CV values in most cases. This indicates that the Kindschi index calculation is a reliable method also for fish of different sizes (Table 2).
3.4. Number of splits for each fin
The frequency of unsplitted and splitted fins was not higher in trout fins in any of the fin condition categories from the first trout farm. However, for the second fish farm, a significant correlation of the presence of fin splits and the categorization of the fin condition was observed for the dorsal fin (p = 0.033) and the ventral fin on the right body side (p = 0.047), whereas the other ventral fin was showing a tendency for similar relations (p = 0.084). For the remaining fish species, no correlation of fin split presence and fin condition was observed.
3.5. Fin length relative to the fin basis
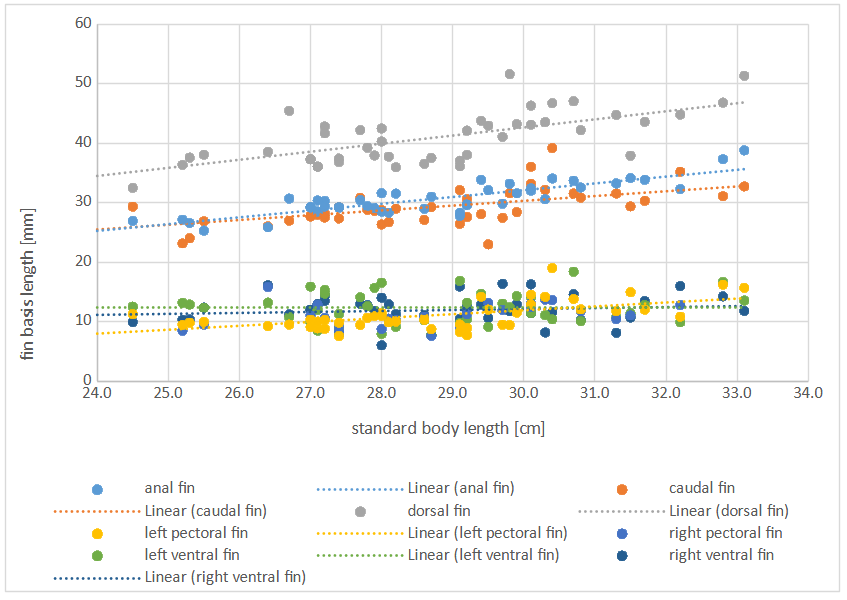
The calculation of the fin ray length L1, L2 and L3 relative to the basis of the fin showed low variation coefficients between size classes for most of the fins, but a high difference between the size classes for the dorsal fin. Moreover, there are several high values that have been observed for the CV for all fish species (Table 2). This indicates that the calculation of the fin length L1, L2 or L3 relative to the fin basis produces variable data for small, medium-sized and large fish. These indices would therefore produce less reliable data if the fish are variable in size.
The differences in these indices may also be related to individual differences in the width of the fin basis in relation to the standard body length. This relation is shown in Figure 4 for rainbow trout and confirms that bigger fish have an increased length of the fin basis except for the ventral fins, but the individual variance is quite high. The resulting linear model parameter are shown in Table 3.

3.6. Fin area relative to the body length
Using software-based area measurements for each fin resulted in the calculation of the fin area relative to the total body length or the standard body length. Comparison of these area-related indices revealed that there is a slightly higher CV value for these indices compared with the Good`s index or the two Kindschi indices (Table 2) for the fish farms that have been investigated. It can therefore be assumed that there is a higher fish size-dependent variance in the data set.

3.7. Correlations of the fin indices with the visual fin scoring
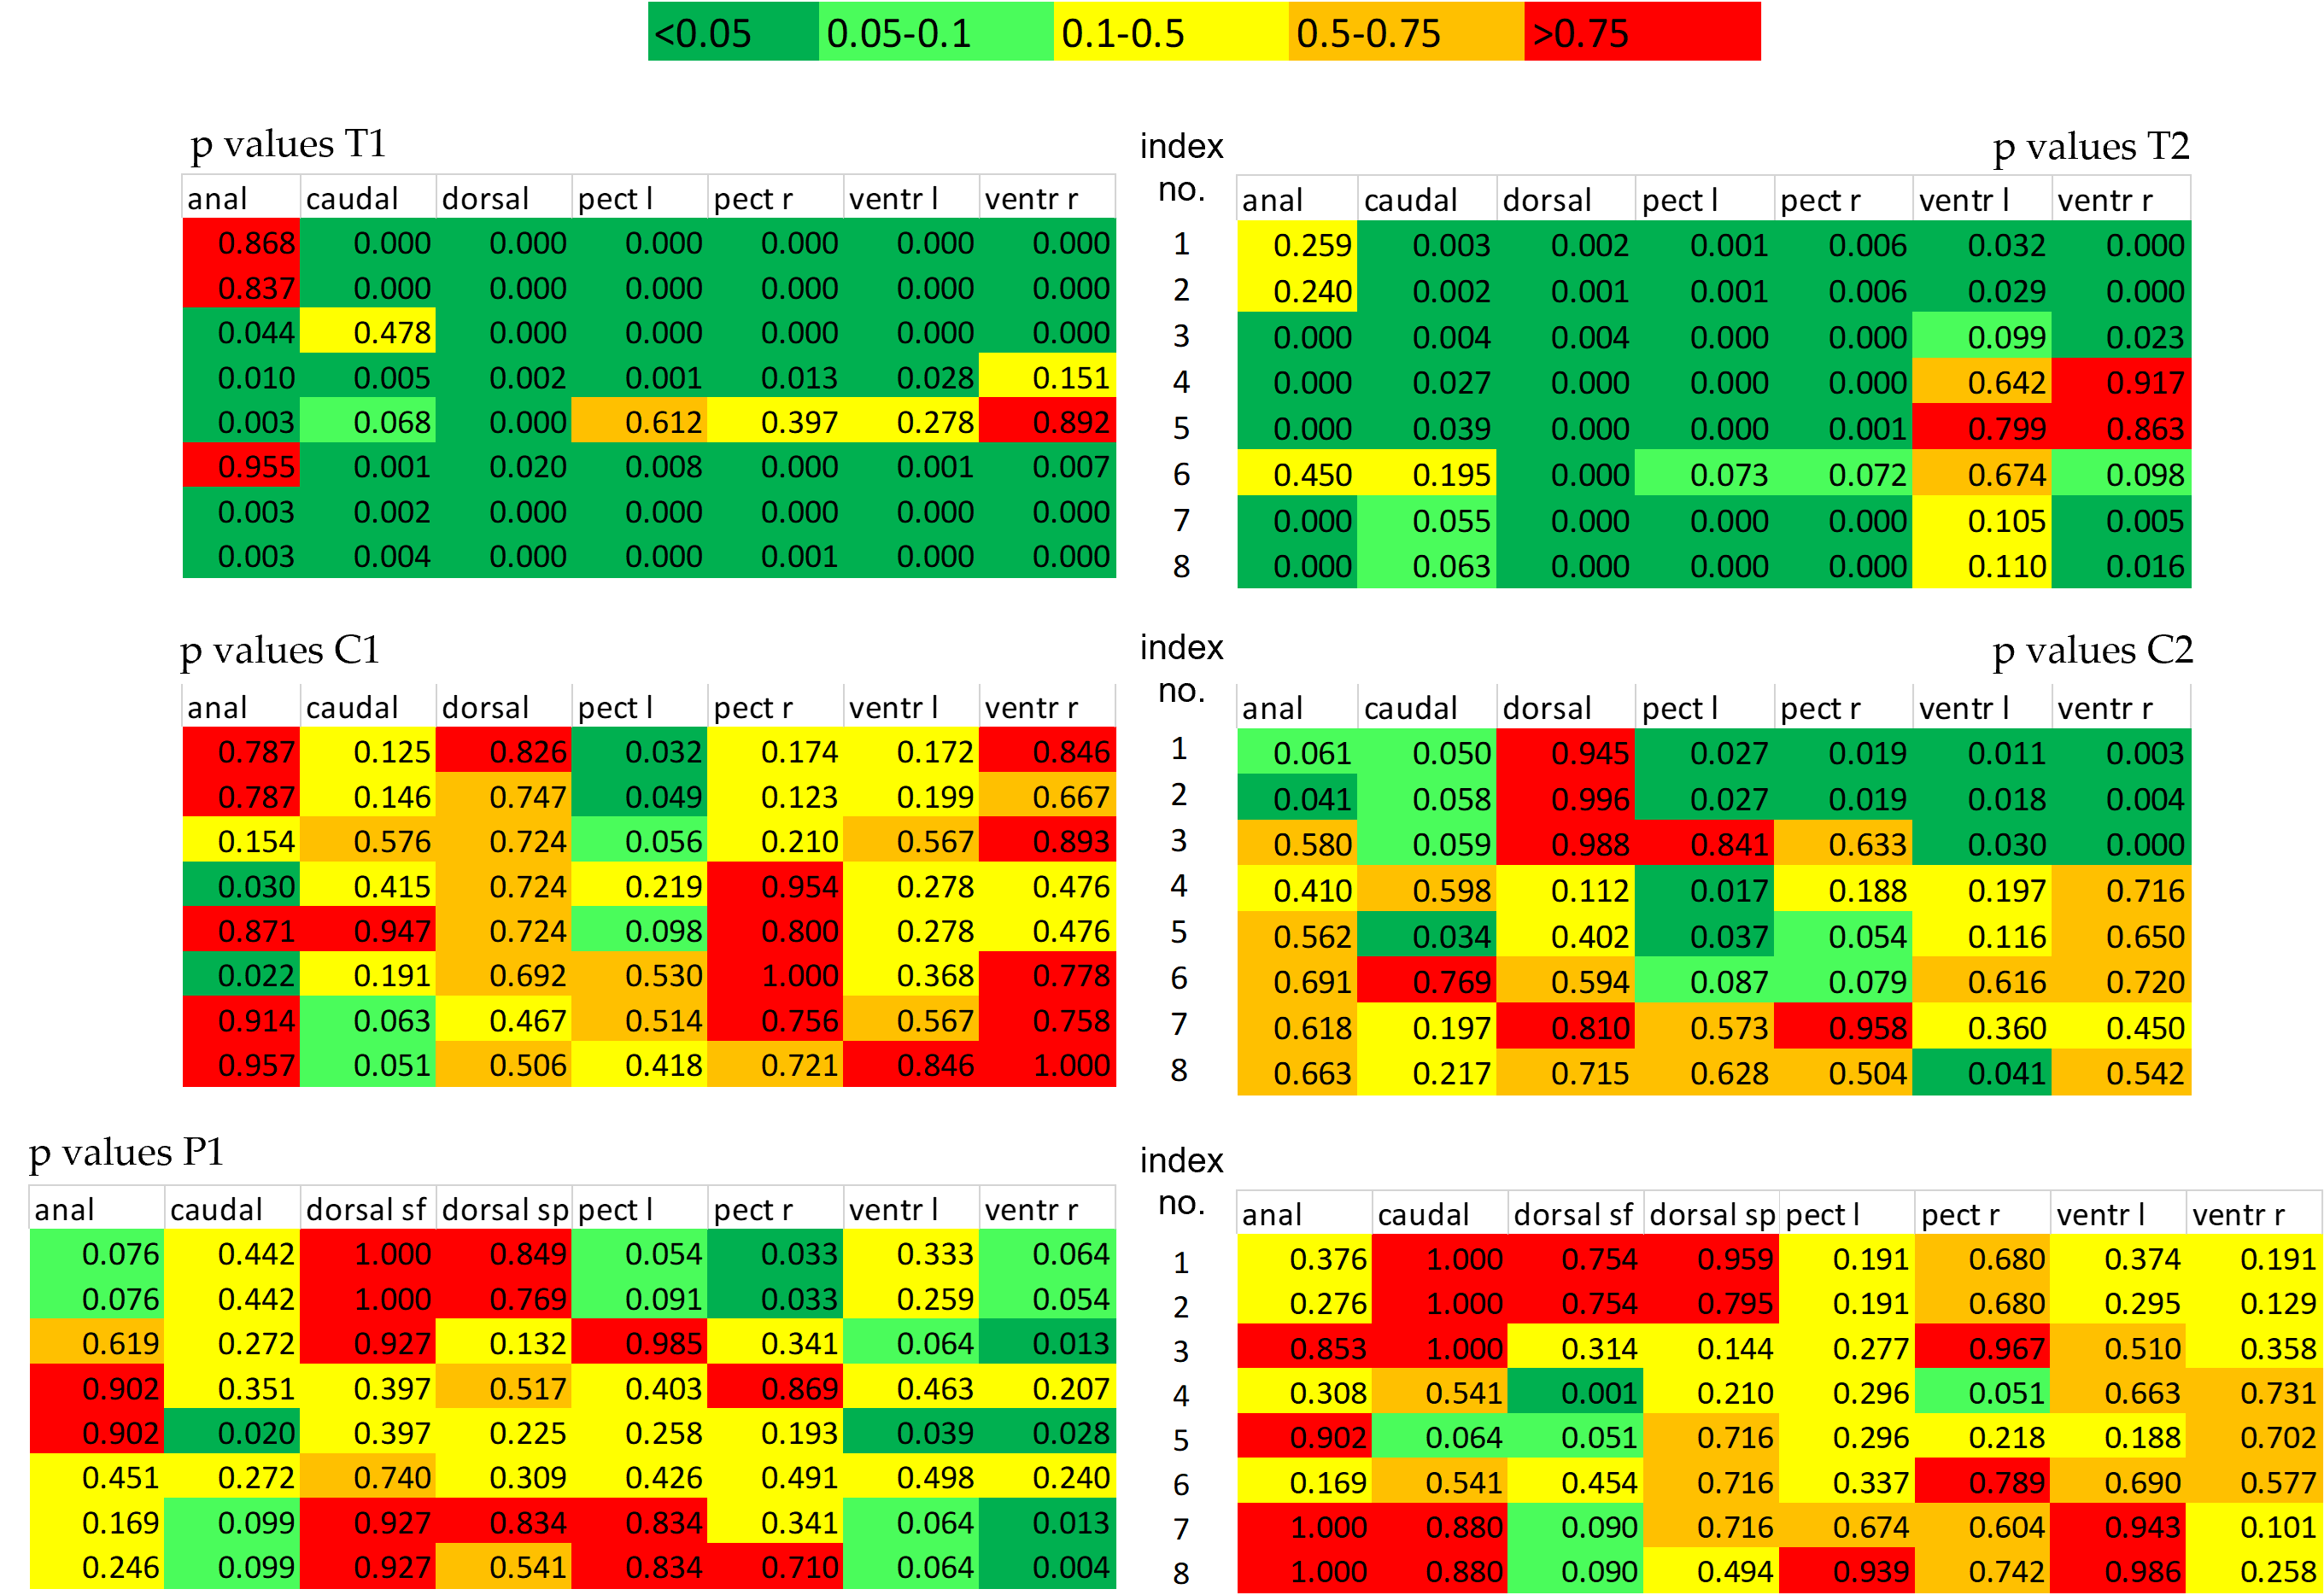
The two trout farms show the same pattern of correlations of the fin indices with the visual fin scoring. Moreover, the correlations can be strong (Figure 5) and highly significant (Table 4), e.g., for the dorsal and the pectoral fins. This clearly shows that fin index assessment is a reliable parameter for this fish species, and especially the area-based calculation methods result in highly significant correlations with the visual fin scoring method.

In contrast, the correlation patterns for the carp farms show clear differences between the two farms (Figure 5), although the area-based fin indices show highly significant correlations with the visual fish scoring for both farms (Table 4). This indicates that for individual farms the fin area indices can be reliable parameters, although they may not be directly comparable with the area indices of other carp farms.
Finally, the two perch farms show different correlation coefficients (Figure 5) which are not significant for most indices (Table 4). However, it should be noted that the perch farms have only been visited once and therefore less data points were available for the correlation analyses which probably influences the reliability of the data sets.
4. Discussion
4.1. Visual fin condition of each fish species and comparison of farms
Visual fin condition assessment is a common part of welfare assessment for salmonids but also has been transferred to other fish species (Stien et al. 2018; Flores-García et al. 2022). The visual fin scoring revealed that for farm T1 the fins had lower conditions than compared with T2. Opposite to that, the carp farm C1 had fish with slightly lower fin scores compared with C2. For the perch farms investigated, no clear size-dependent difference in fin condition could be noted. However, this could have been different if more data would have been available. Nevertheless, the data for small perch contradict an earlier study indicating that the dorsal fin is least affected in small perch farmed in a recirculating aquaculture system (Stejskal et al. 2011). In the present study, it was also noted that the pectoral fins of perch are less affected than the ventral fins. This indicates that the fin condition of farmed perch shows considerably variation between aquaculture systems and not all fins are equally relevant for a subsequent welfare assessment.
Finally, the fin condition of fish appears to depend on a number of factors, such as water quality (Larmoyeux and Piper, 1973; Winfree et al., 1998), characteristics of the rearing environment (Arndt et al. 2001; Stejskal et al. 2011), the feeding regime (Rasmussen, Larsen, and Jensen 2007; Klíma et al. 2018; Flores-García et al. 2022), stocking densities (Rasmussen, Larsen, and Jensen 2007), but also the presence of aggressive behaviour (Latremouille 2003). However, there is no study comparing a number of fin condition measures for the same fish. Moreover, each fish species is differently affected by rearing factors. Accordingly, clear species-specific differences in fin scores could be observed in the present study. Since the trout included in the present study were reared in outdoor facilities, they also showed pronounced seasonal variation of the fin indices (see additional data: https://figshare.com/articles/dataset/Fin_condition_data_over_time_and_also_shown_for_the_different_fish_size_classes/25692924).
4.2. Recommandation of fin condition calculation methods
If a trout or a carp farm desires to compare fin condition measurements across size classes, the calculation of fin ray length relative to the fin basis appears not to be suitable for this fish species. Genetic factors appear to influence the fin condition assessments since there were differences in the assessment between the trout farms T1 and T2.
Carp farm C1 and C2 have the same supplier for fingerlings which excludes a strong influence of the genetical background on the carp fin assessments. Still, there are considerable differences in fin condition between these two farms. In addition, the differences between the two farms impair the recommendation of an optimal fin condition parameter. The correlation analyses indicate that the area index methods are suitable for carp farms, whereas the analysis of the CV reveals that the index according to Good et al. (2011) shows slightly less variation for fish of different sizes than the area-based methods. This may also indicate that the index according to Good et al. (2011) is less sensitive for fish of different sizes.
For the perch farms, less reliable data are available and therefore the recommendations for perch farms are more difficult. The origin of the perch from P1 is different from P2 which indicates that also genetic differences may have influenced the present analyses.
In summary, the Kindschi and improved Kindschi index for carp appears to have a lower variability for fish of different sizes. Therefore, the Kindschi index and the improved Kindschi index appear to be suitable for farms with heterogenous sizes of the fish. The disadvantage of the Kindschi indices may be the rating of fins as good in condition even when a part of the fin is missing. This would not happen if area-based calculation methods would be used. Although it takes more time to analyse the fin area than to measure the length of a fin ray, the comparison of the fin area to the total body length indicated that this is a reliable method to assess the fin condition for trout and carp in the present study. In addition, we assume that the area assessment has the highest potential for being an automated fin rating method based on computer algorithms in the future compared with the remaining fin assessment methods.
5. Conclusions
Fin condition values can be obtained from anaesthetized or slaughtered fish so that fish farmers may easily record these values themselves. If fin condition assessments are included in the routine work on-farm, enough data will be accumulated which will allow the evaluation of typical CV for the fin indices of the specific fish batch. Species-specific differences clearly affect fin condition and should be respected when using fin condition indices for welfare assessments. For the present study, the optimal fin condition assessment method for the caudal and dorsal fin of rainbow trout is the use of the area indices (AI). For common carp, the visual assessment of the fin score is not well correlated with the different indices that may be calculated from fin measurements. This was caused by generally good fin conditions of carp that did not allow classification of the fins into more than 3 different categories. Further inclusion of less well-shaped fins for carp would have influenced the results, but no fish with bad fin condition have been available. Finally, the AI methods show the highest potential for future automatization of fin assessments in the future. However, more data from different fish farms should be obtained to support the current conclusions in the future.
Conflicts of Interest
The authors declare that there are no conflicts of interest regarding the publication of this paper.
Acknowledgement
This study was financially supported by the Bridge programme (Project No. 40B2-0_180864) supported by the Swiss National Science Fonds (SNSF) and the InnoSuisse.