INTRODUCTION
Shrimp farming has been devastated by several diseases. More shrimp diseases are emerging and re-emerging. Disease outbreaks can be avoided by making the shrimp tolerant to pathogens and by minimising stress. Stressful conditions can be prevented by optimising environmental conditions or by eliminating risks factors including carrier organisms (Tendencia, 2012). Pond soil is an important reservoir for pathogens which attack the cultured organism when stressed due to poor environmental conditions. Proper pond preparation is one way to optimise environmental conditions and eliminate pathogens in the soil. One important step in pond preparation is hydrated lime application.
Hydrated lime (calcium hydroxide, or Ca(OH)2) is a dry powder made from limestone. It is created by adding water to quick lime in order to turn oxides into hydroxides. Hydrated lime is applied in the pond to neutralise or increase soil pH, improve liberation of bases, biological activity, oxygen decomposition, to remove turbidity and as a disinfectant or to treat diseases (Chowdhury and Rhaman 2012). Application of 3-5tons/ha hydrated lime increases soil pH to 11 and kills most organisms (Boyd 2012). At pH 11, WSSV becomes non-infectious after 10 min exposure and white spot syndrome virus (WSSV) is killed within 3 h (Chang, Chen, and Wang 1998). WSSV capsids are degraded at pH 11 (Chen et al. 2012). Lime is also effective in controlling snails which are intermediate hosts of trematodes (Mitchell et al. 2007). Lime application has been reported to treat acanthocephaliasis and the epizootic ulcerative disease of fish (Huang et al. 1989; Das and Das 1993). Heterotrophic, ammonifying, denitrifying, cellulose decomposing and phosphate solubilising bacteria in the soil are drastically reduced after lime application at 1-2 tons/ha (Ganguly, Chatterjee, and Jana 2000).
In spite of the wide spread use of lime and several reports on its efficiency against some pathogens, there is limited information on its effect on pond bacterial flora. This paper describes the effect of hydrated lime applied at 5tons/ha followed by 7 tons/ ha on soil wet/dry pH and bacterial flora of brackishwater earthen ponds.
MATERIALS AND METHODS
Pond Site and Preparation
Two experiments were conducted. In the first experiment, three 600 m2 earthen ponds were used. The ponds were drained and allowed to dry for two weeks; however, the pond bed remained wet due to intermittent rain. Ponds were applied with hydrated lime at 5 tons/ha followed by another 7 tons/ ha after 24 h. The second application was done to attain the target pH of 11 which was not attained during the first application. Lime was allowed to stay in the ponds for 8 days. On the 8th day, after soil sample collection, the pond was flooded up to 50 cm water depth. Water was flushed out after 48 h.
The second experiment was conducted to determine the effect of lime application to soil pH 11 on WSSV. Three 750 m2 earthen ponds were used. WSSV positive shrimp were harvested from the ponds prior to the experiment. The ponds were drained and allowed to dry for two weeks; but due to intermittent rain, pond bottom remained wet. Lime was applied to the 3 ponds at 12T per hectare.
Soil Sampling and Analysis
Experiment 1
Soil samples were taken from the 3 ponds before hydrated lime application, daily until the 8th day before flooding and on the 10th day after water was flushed out. Soil samples were collected from the upper 6-10 cm of the pond bottom in an S type order from nine stations in each pond; a total of approximately 1kg were collected from each pond. The nine samples from each pond were thoroughly mixed before analysis. A portion of the soil samples were immediately processed for soil bacterial count and wet pH measurement. Remaining soil samples were air dried, sieved and analysed for dry pH, organic matter content, available sulfate, available iron and available phosphorus.
Wet and dry soil pH’s were measured using a pH meter (Takemura brand, Model DM-13). Available phosphorus was measured using Olsen’s method, available sulfate by turbidimetry, and available iron by colorimetry. Organic matter content was measured using the method described by Walkley and Black (1934).
The amount of lime needed to observe an increase in the wet soil pH by 1 unit (X) was computed using the following formula:
X=amount of lime appliedpH after lime application−pH before lime application
Soil Bacteria Count
Soil samples (1 g/sample) were homogenised in 9 mL sterile sea water (SSW) and serially diluted. Diluted samples (0.1mL) were plated onto nutrient agar (NA, Merck), Thiosulfate Citrate Bilesalt Sucrose Agar (TCBS, Pronadisa), Pikovskya agar (PA, Difco) and Jensen’s agar medium (JA, Difco) in duplicates. NA and TCBS plates were incubated for 24h at room temperature; PA and JA for 48h. Total bacterial count was counted on NA after incubation; luminous bacteria were observed and counted in a dark room. Phosphate solubilising bacteria were counted on PA; nitrogen fixing bacteria were counted on JA. Vibrios were counted on TCBS, a selective medium for Vibrios. No further tests were done to identify the Vibrios that grew on TCBS. Vibrios that grow yellow colonies (YV) and those that grow green colonies (GV) were separately counted on TCBS. Presumptive Vibrio count (PVC) is the sum of YV and GV. Percentage green Vibrios was computed using the following formula:
Percentage green vibrios (PGV) =green Vibrio (GV)Total Vibrio count (TVC)∗100
Statistical analysis
Bacterial counts were log transformed before analysis. Gathered data were analysed using SPSS V. 16. One-way ANOVA was used to determine any difference in the data gathered. Duncan’s multiple range tests was used to compare means. Pearson’s Correlation analysis was used to determine the correlation between the gathered data.
Data were analysed 2 ways. First, data gathered from Day 0 before lime application, daily after lime application until the 8th day lime was allowed to stay in the pond and on the 10th day after flushing were analysed to determine temporal changes in the bacterial flora. Averages of the measured parameters during the 8 days lime was allowed to stay in the pond was computed and used in the second analysis. The second analysis was done to determine if liming and flushing after liming affects pond soil microbiota. Data used in the last analysis are those gathered before lime application, averages of the replicates during days lime was allowed to stay in the pond and Day 10 after flushing.
Experiment 2
Soil pH of the three 750sqm ponds were measured before and 24h after lime application. Soil samples were analyzed for WSSV detection before and 24h after lime application using qPCR. Optimized protocol for duplex qPCR TaqMan Assay for WSSV and IHHNV was used to detect the presence of WSSV (Tendencia EA, unpublished Terminal Report). Briefly, DNA was extracted from the soil samples using NucleoSpin® Soil kit (Macherey-Nagel). Duplex qPCR TaqMan Assay for WSSV and IHHNV was performed using a 20uL reaction mixture consisting of 1X TaqMan Multiplex Master Mix, 0.2 uM WSSVq primers (WSSVqF 5’-TGGTCCC GTCC TCATCTCAG-3’ and WSSVqR 5’-GCTGCCTTGCCGGAAATTA-3’), 0.2 uM IHHNVq primers (IHHNVqF 5’-TAC TCC GGA CAC CCA ACC A-3’, IHHNVqR 5’-GGC TCT GGC AGC AAA GGT AA-3’), 0.25 uM WSSVq Probe (6-FAM 5’-AGCCATGAAGAATG CCGTCT ATCACACA-3’ TAMRA), 0.25 uM IHHNVq Probe (VIC 5’-CCAGACATAGA GCTACAAT CCTC GCCT AT TTG -3’ TAMRA) and 10 - 100ng DNA template. PCR thermal cycle was performed using Rotor-GeneTM 6000 with the following program: 95 °C for 10 minutes and 55 cycles of 95 °C for 15 seconds and 60 °C for 60 seconds. Quantification of WSSV was done using reading at green channel.
RESULTS
Average soil pH in the three 600sqm ponds before the first lime application was 6; the pH increased to 8.42 24h after lime application at 5T/ha.. The pH increased from 8.42 to 11.88 24h after the second lime application at 7T/ha. In the first application, the computed amount of lime needed to observe an increase in wet pH by 1 unit is 2.06T/ha; 2.02T/ha in the second application.
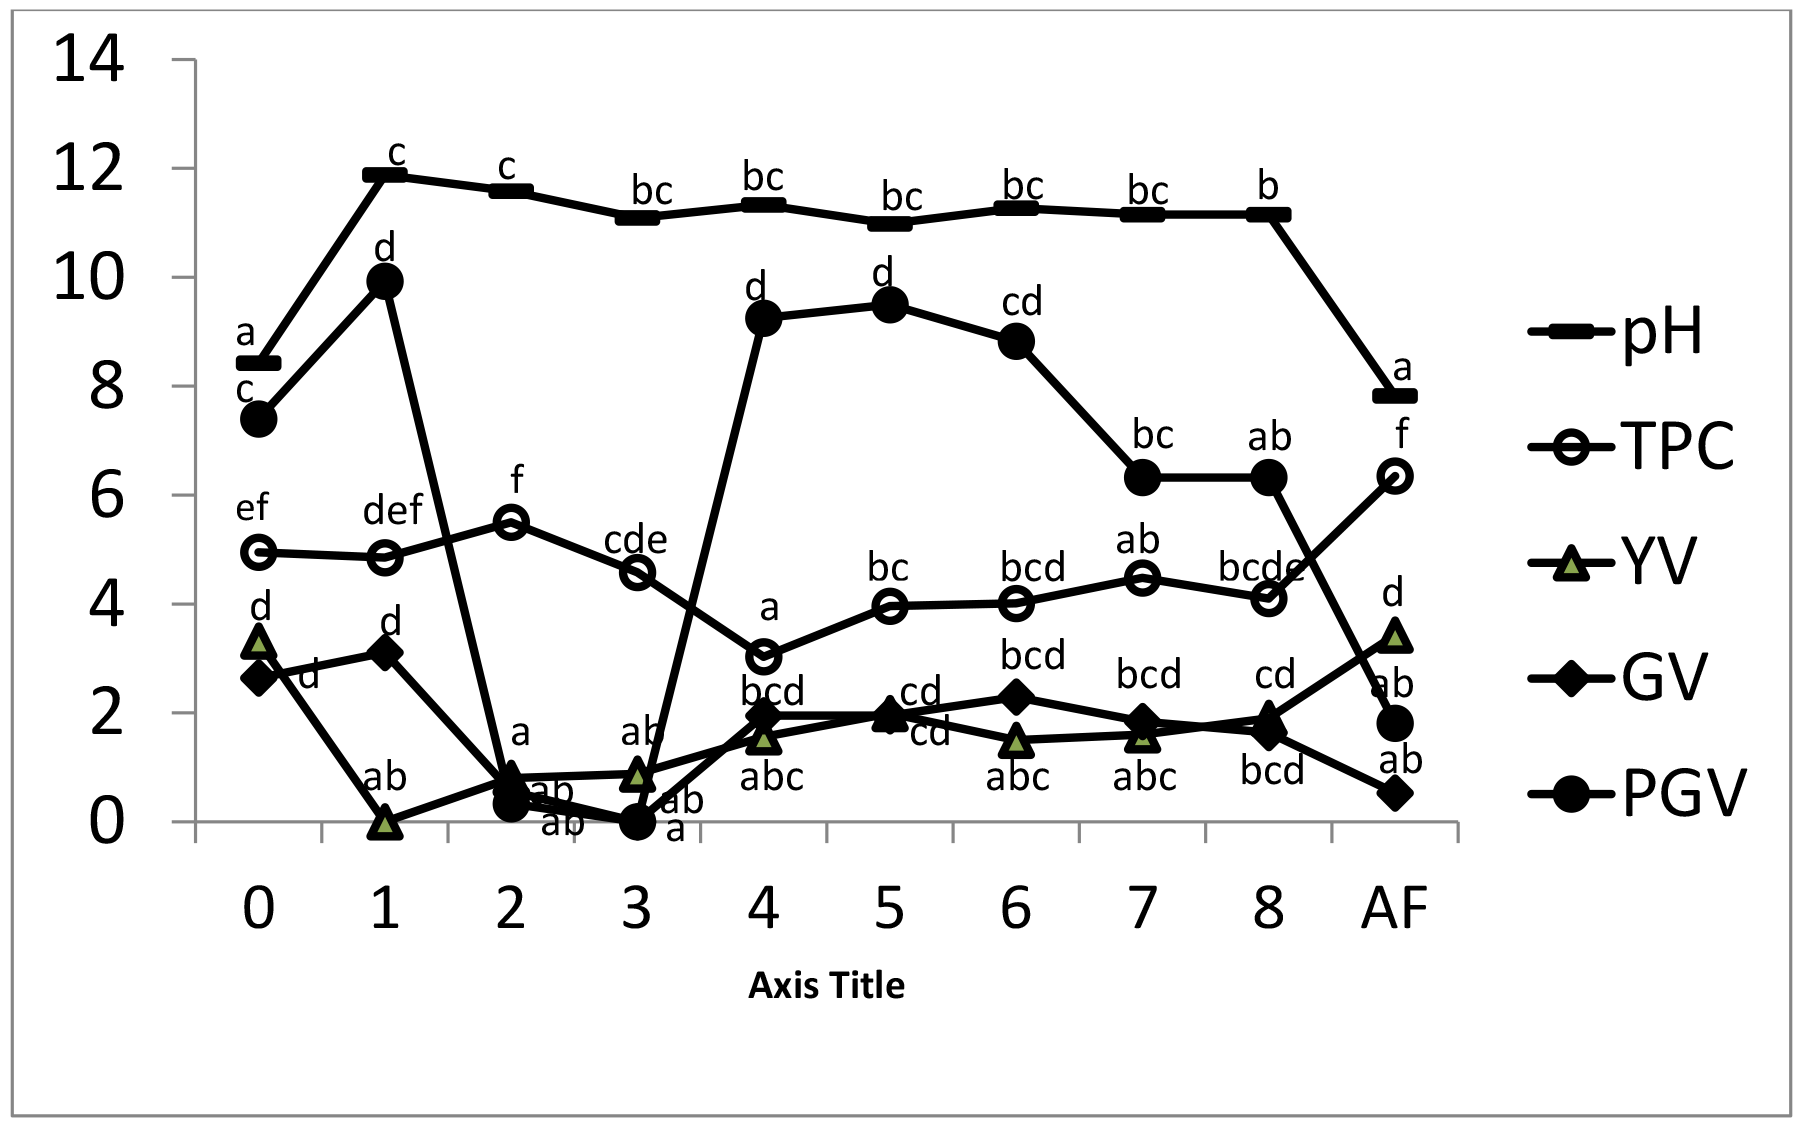
Significant differences (P<0.01) were observed in the wet pH, and the soil bacterial flora except for luminous bacteria in samples taken before liming, daily, and during the 8 days lime was allowed to stay in the pond and on 10th day after flushing (Table 1). Significantly higher (P≤0.05) soil wet pH (10.58-11.88) was observed during liming from Day 1 to Day 8 compared to pH before second liming (8.42) and after flushing (7.82) (Figure 1). Soil pH significantly increased 24h after lime application and remained high until the pond was filled with rainwater in the evening of the 2nd and 7th day; and after flooding and flushing on the 10th day. Wet pH before liming and after flushing were not significantly different (P>0.05). During the 8-day liming period, fluctuating counts were observed for TPC, PVC, YV, and GV. YV gradually increased from day 6 to day 8; while, GV gradually decreased from the 5th day (Figure 1). Consequently, PGV decreased from day 6 to day 8 and was significantly lower at AF than at BL.
_of_the_wet_soil_ph_and_bacterial_flora_(log_10)_of_soil_samples_at_day_0_(b.png)
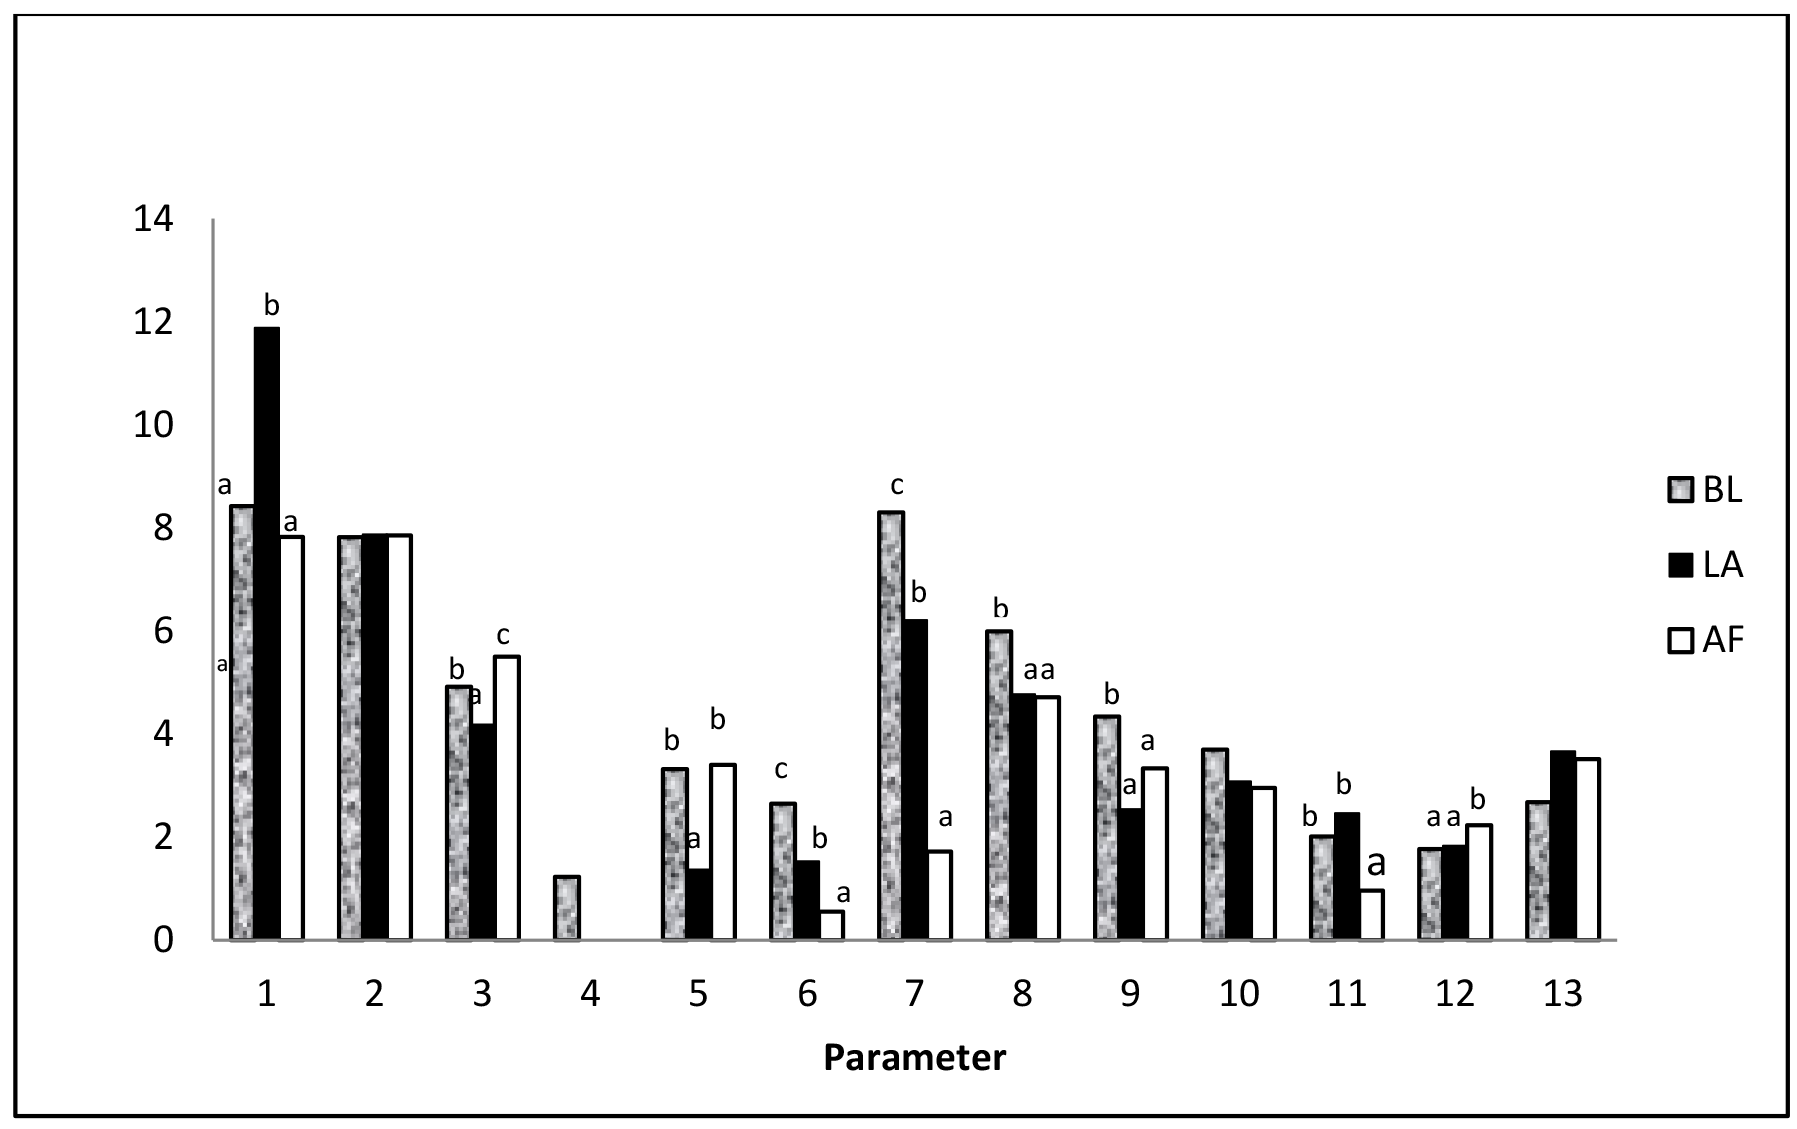
Dry pH, iron and organic matter contents were not significantly different in samples taken before lime application (BL), during lime application (LA, average of the measurements of samples taken during the 8 days lime was allowed to stay in the pond), and after flushing (AF) (Table 2). Significantly higher wet pH, PSB, and NFB were observed at LA than at BL and AF; YV significantly low at LA (Figure 2). GV and PGV were significantly lower at LA than at BL, lowest was observed at AF. AP was significantly low at AF; while AS, was significantly high.
_of_the_observed_parameters_before_lime_application_(bl)__average_of_the_8_d.png)
Wet pH was negatively correlated with TPC. YV and PVC (P<0.01); positively with AP (P<0.05) (Table 3). PGV is positively correlated with GV; PSB with NFB and OM. AP is positively correlated with wet pH and PGV; negatively with TPC, YV and PVC.
Dead shrimp, crabs and fish were already observed on the first 2 days after lime application.
In experiment 2, pond soil pH before liming was 6; the pH increased to 11, 24 h after lime application. WSSV was detected from the soil of the 3 ponds at an average of 3.66 x 10⁴ copies/g soil; the virus was not detected from the soil 24h after lime application.
DISCUSSION
The present study found that hydrated lime application at 5 tons/ha did not increase the pond soil pH to 11 after 24h. This is contrary to the report that application of 3-5tons/ha hydrated lime could increase soil pH to 11 (Boyd 2012). Previous reports did not specify the initial pH that will give a pH 11 after lime application and whether it is wet or dry pH. We found in this study that 2T/ha of hydrated lime are required to see a one unit increase in wet pH.; lime application does not affect dry pH. An increase in pH can be observed 24h after hydrated lime application and may remain high unless diluted.
Results of the study showed that lime application to increase the soil pH to 11 did not kill the natural flora of the soil. Although, growth of the heterotrophic bacteria (TPC) decreased after lime application or with an increase in pH, the count increased after flushing. The decrease in the heterotrophic bacteria after lime application is consistent with Ganguly, Chatterjee, and Jana (2000). Heterotrophic bacteria include all kinds of bacteria both harmful and beneficial. In the present study, it is possible that the heterotrophic bacteria after flushing are the beneficial ones as shown by the positive correlation between the heterotrophic bacteria and the yellow vibrios and in the increase in the yellow Vibrios and decrease in the percentage green vibrios. Yellow vibrios (YV) belong to the heterotrophic bacteria reported to use nitrogen in the water for cell growth and reproduction (Zehr and Ward 2002). Most vibrios that are beneficial or have probiotic effect belong to the yellow vibrios, while most of the harmful vibrios produce green colonies on TCBS. The probiotic effect of V. alginolyticus, a yellow Vibrio, against WSSV has been demonstrated by Sharma et al. (2010). Furthermore, lower percentage of green vibrios (PGV) has been reported to be a protective factor against some diseases like the luminous bacterial disease and WSSV (Tendencia and Verreth 2011).
The reduction in the counts of the nitrogen fixing bacteria and the phosphate solubilizing bacteria during lime application and after flushing is consistent with a previous report that ammonifying, denitrifying, and phosphate solubilizing bacteria in the soil are drastically reduced after lime application at 1-2 tons/ha (Ganguly, Chatterjee, and Jana 2000). The decrease in the phosphate solubilizing bacteria explains for the reduced available phosphate after flushing. Phosphate solubilizing bacteria enhances the availability of phosphate through the solubilization and mineralization of organic and inorganic phosphorus in the soil (Khan et al., 2009). The reduced counts for the nitrogen fixing bacteria after flushing could be attributed to the increase in the yellow vibrios. As previously mentioned, the yellow vibrios use nitrogen in the water for cell growth and reproduction. Liming increases microbial activity resulting in the increased mineralization of organic matter (Fuentes et al. 2006). This accounts for the increase in available sulfate after flushing. The present result is in accordance with Valeur and Nilsson (1993) who reported higher organic S in limed than in unlimed humus, incubated in an open system; and highest microbial activity in the former.
The non-detection of WSSV in soil after lime application to pH 11 is in consonance with the report of Sharma et al. (2010) that V. alginolyticus, a yellow Vibrio has a priobiotic effect against WSSV. The yellow Vibrios dominate over the green Vibrios in the soil after lime application to pH 11 in this study. Furthermore, at pH 11, WSSV capsid is degraded (Chen et al. 2012). Capsids shield the genetic material against the action of digestive enzymes; helps in the attachment of the virus to the host cell membrane; and it contains enzymes, or proteins that enables the virion to penetrate host cell membranes and transports nucleic acid inside the cells (Qureshi 2016). Disintegration of the capsid prevents viral attachment to the host and viral replication.
The observed dead shrimp, crabs and fish 2 days after lime application to soil pH 11 is consistent with Furtado et al. (2015) who observed a 100% mortality in Littopenaeus vannamei exposed to pH 10.5 which they attributed to oxidative stress. Gill cells are altered during exposure to high pH (Ge et al. 2022). This could negatively affect osmoregulation, respiration, and excretion of nitrogenous wastes (Evans, Piermarini, and Choe 2005) which could have caused the observed mortality of the aquatic organisms. Considering that high pH can cause mortalities in aquatic organisms and the possible negative effect of the lime powder on the gills, it is recommended to flush out the lime 8 days after application
In shrimp farming the accumulation of organic matter and sludge in the pond after harvest brings threat to the next cropping due to the risk of disease occurrence. We recommend lime application to raise the soil pH to 11 as a management tool that shrimp farmers may adopt to prevent disease outbreaks without the use of chemicals or other synthetic products which can be harmful to the environment. Liming encourages the proliferation of the yellow vibrios, controls the growth of the harmful green vibrios and WSSV; and the eradication of carrier species (i.e. crabs) as well as predators (i.e. fish) in the ponds. To implement a 1 unit increase in wet pH, hydrated lime should be applied at 2T/ha.
ACKNOWLEDGEMENT
The study was funded by the Government of Japan (GoJ), under the trust fund awarded to SEAFDEC/AQD (study code: 8300-T-RD-FH0710). Special thanks to Prof. Valeriano Corre, Former Station Head of the Brackishwater Aquaculture Center (BAC), University of the Philippines Visayas at Nabitasan, Leganes, Iloilo, Philippines for the use of the 600sqm experimental ponds; and to Ms. Romelie Torreta-Ortega and Mr. Hernie Gustilo for the technical assistance.